
Multipurpose air quality software for professionals
REAL-TIME DATA | ALWAYS UPDATED
Our web-based air quality monitoring software helps environmental professionals to use and understand air quality data and delivers operational environmental inte- lligence to make better decisions.
Thanks to our bidirectional software, Kunak Cloud offers professionals a new way to handle remote settings configuration, alarms management, calibration and field operations, as well as a complete suite for air quality data analysis.
Kunak Cloud is a flexible modular software designed for easy user account management, simple network opera- tion, intuitive data validation, and simple analysis and reporting.
The Kunak Cloud web platform is the powerful air quality software that completes the comprehensive Kunak AIR solution.

Secure & Confidential
HTTPS/SSL protocols. Confi- dentiality and ownership of data guaranteed by EULA.

Free continuous updates
Be always updated. Enjoy any
new tool or functionality imme-
diately without additional cost.

Secure & Confidential
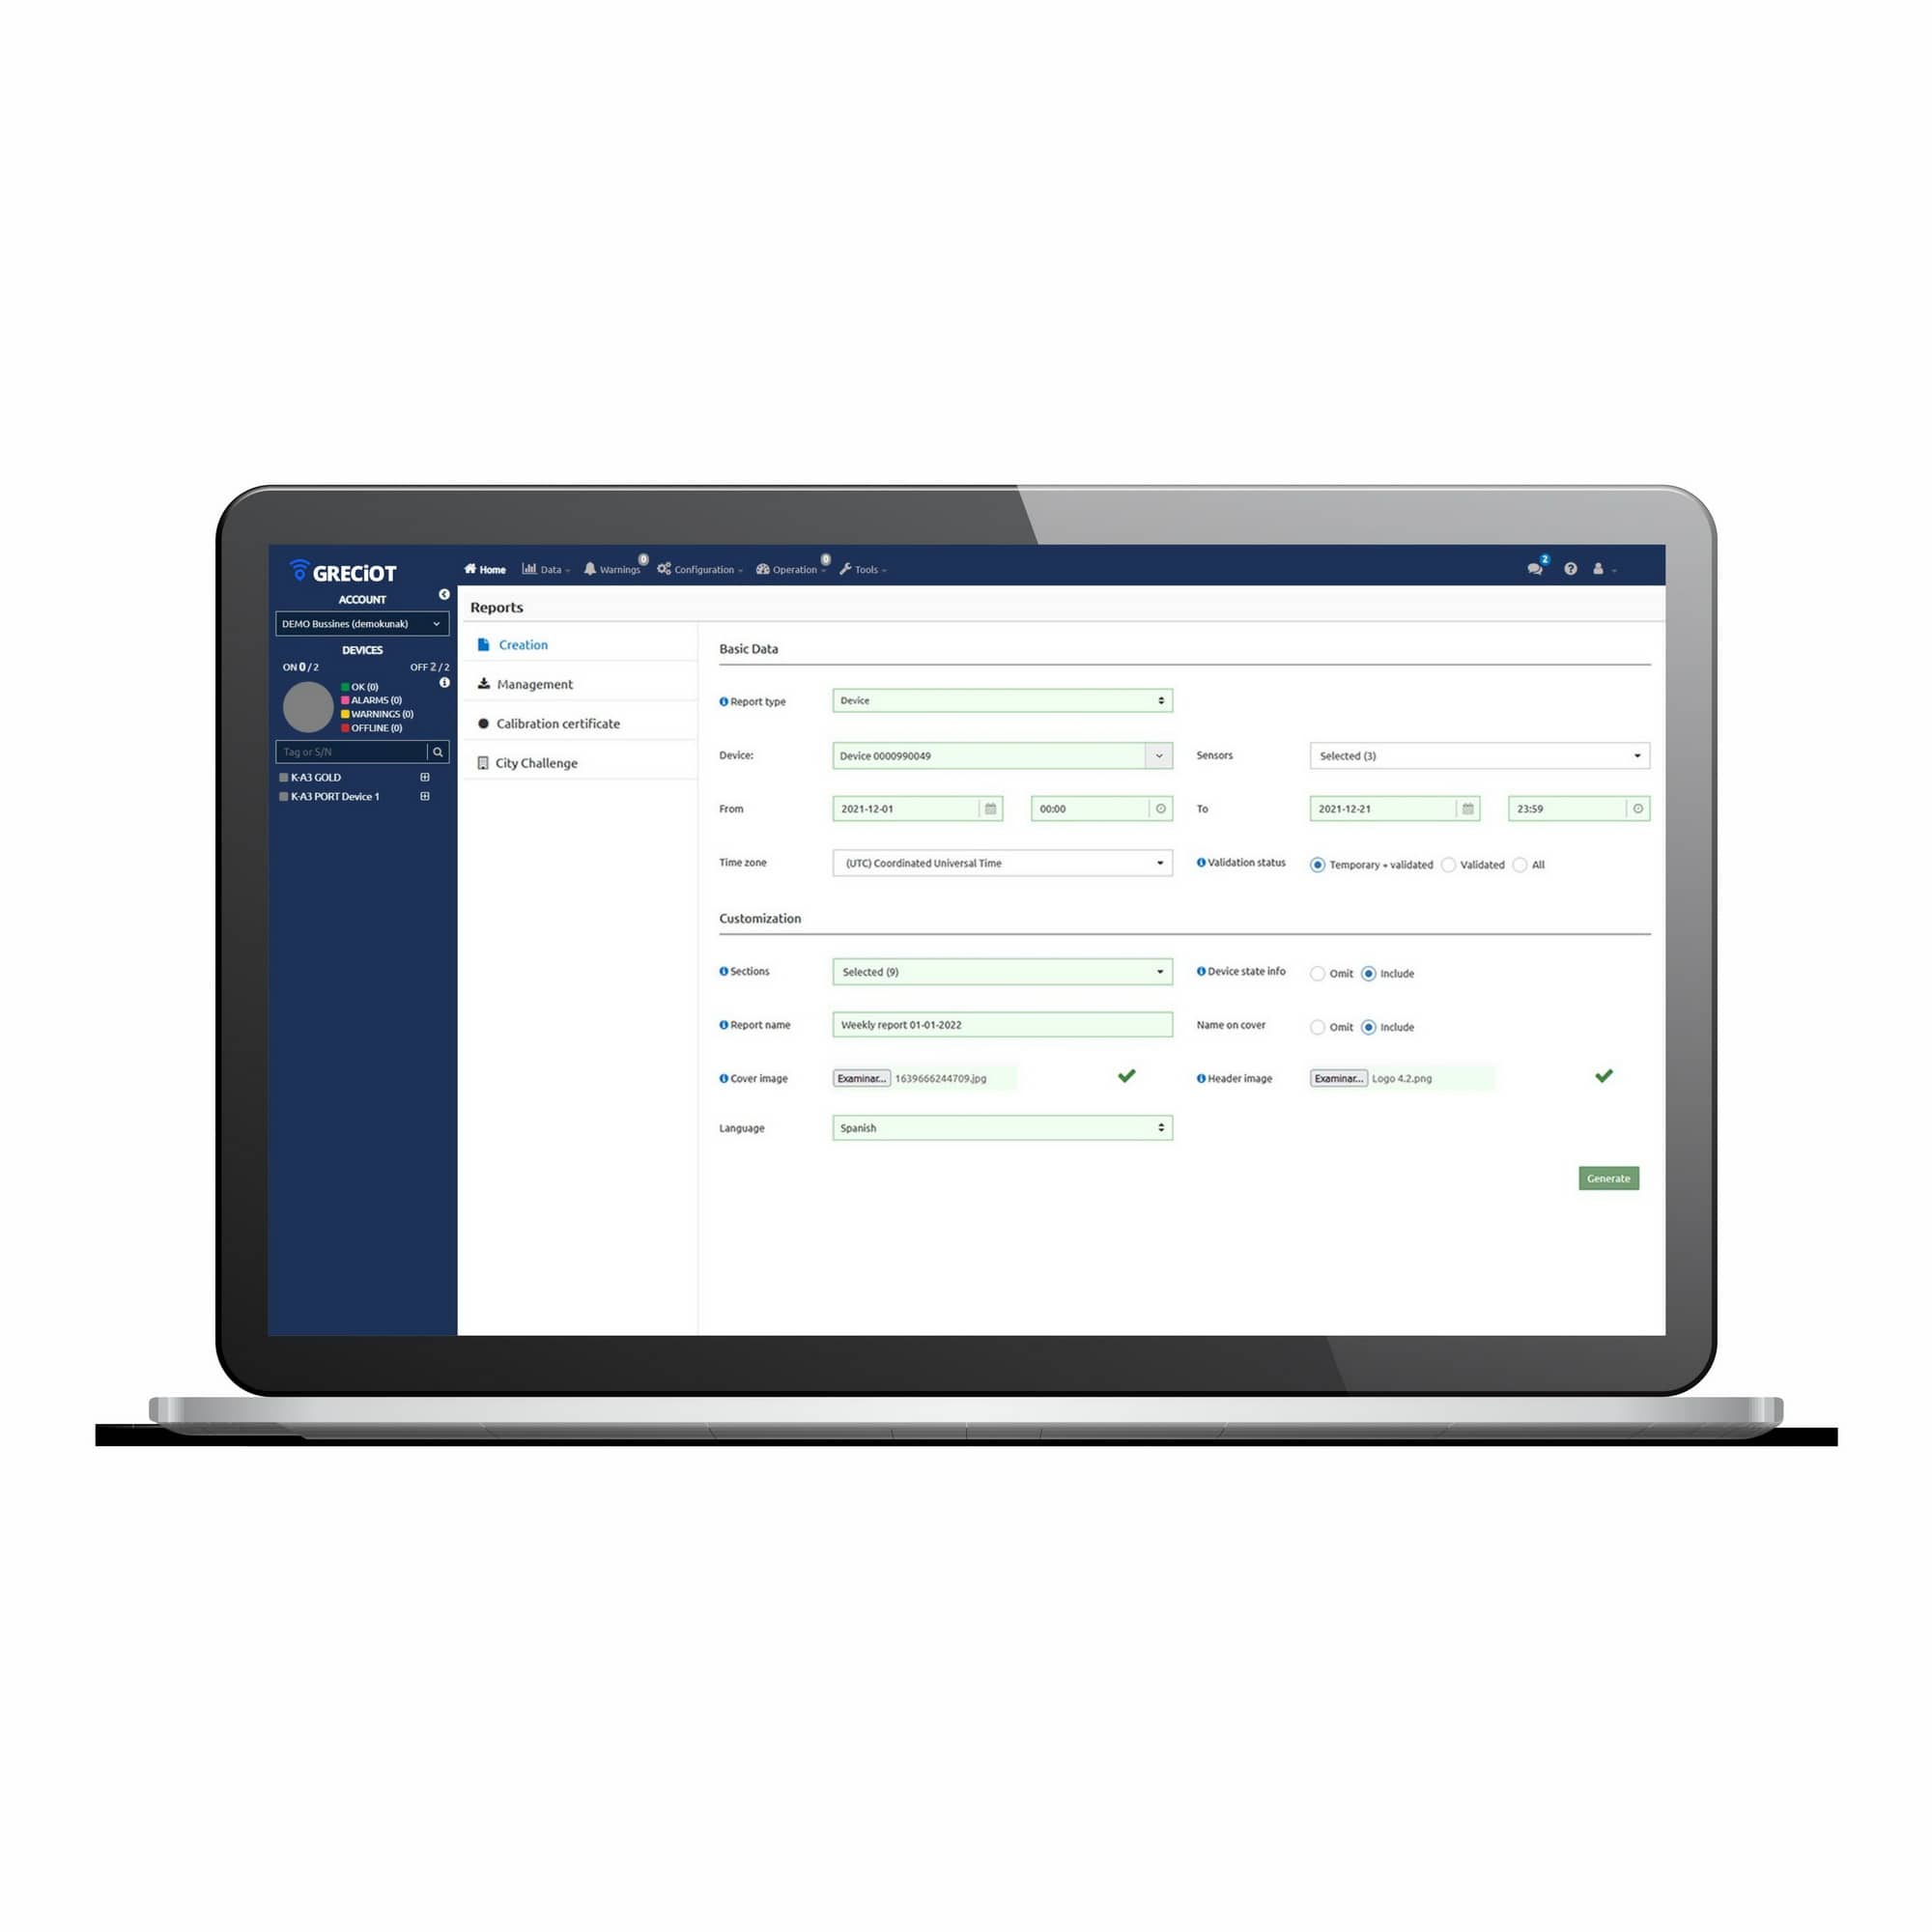
Create customized reports to show AQ data in required for- mats to share with your clients or external agencies.

Automatic supervision
Monitor the health of your sta- tions & sensors remotely and troubleshoot with automatic tips.

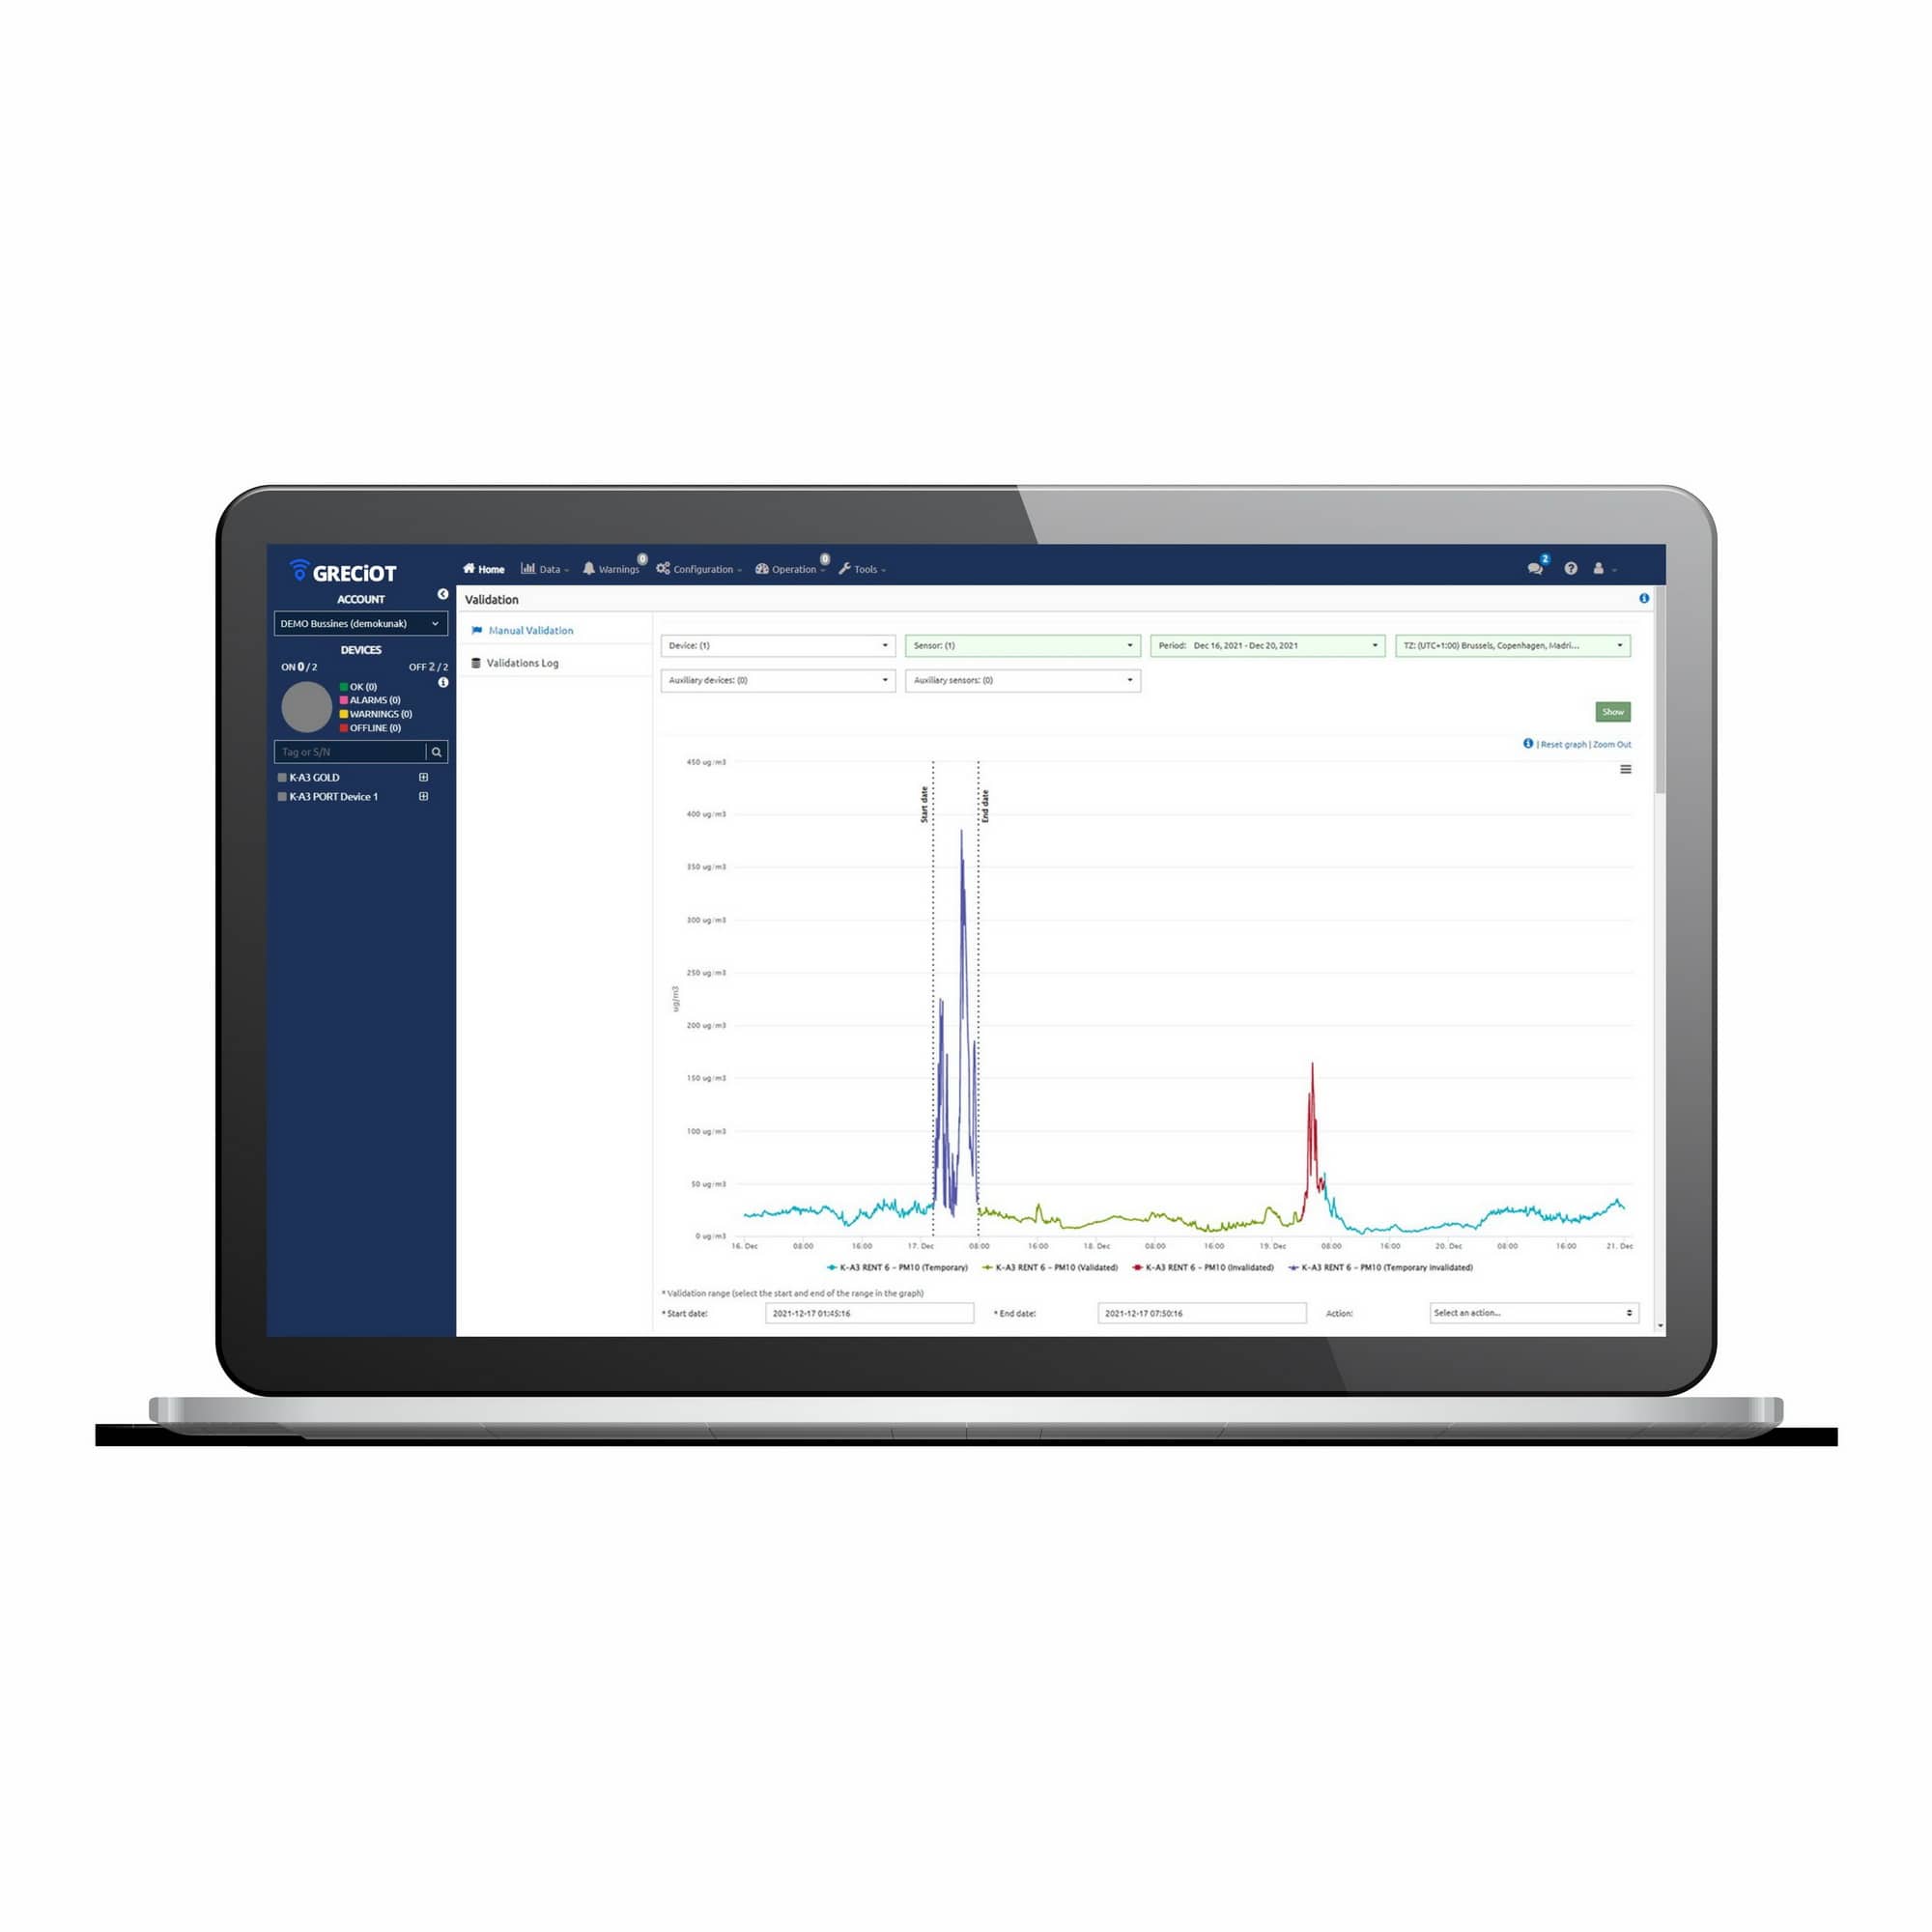
Reliable data guaranteed
Advanced algorithms for auto- matic data flagging. High quality and validated data.

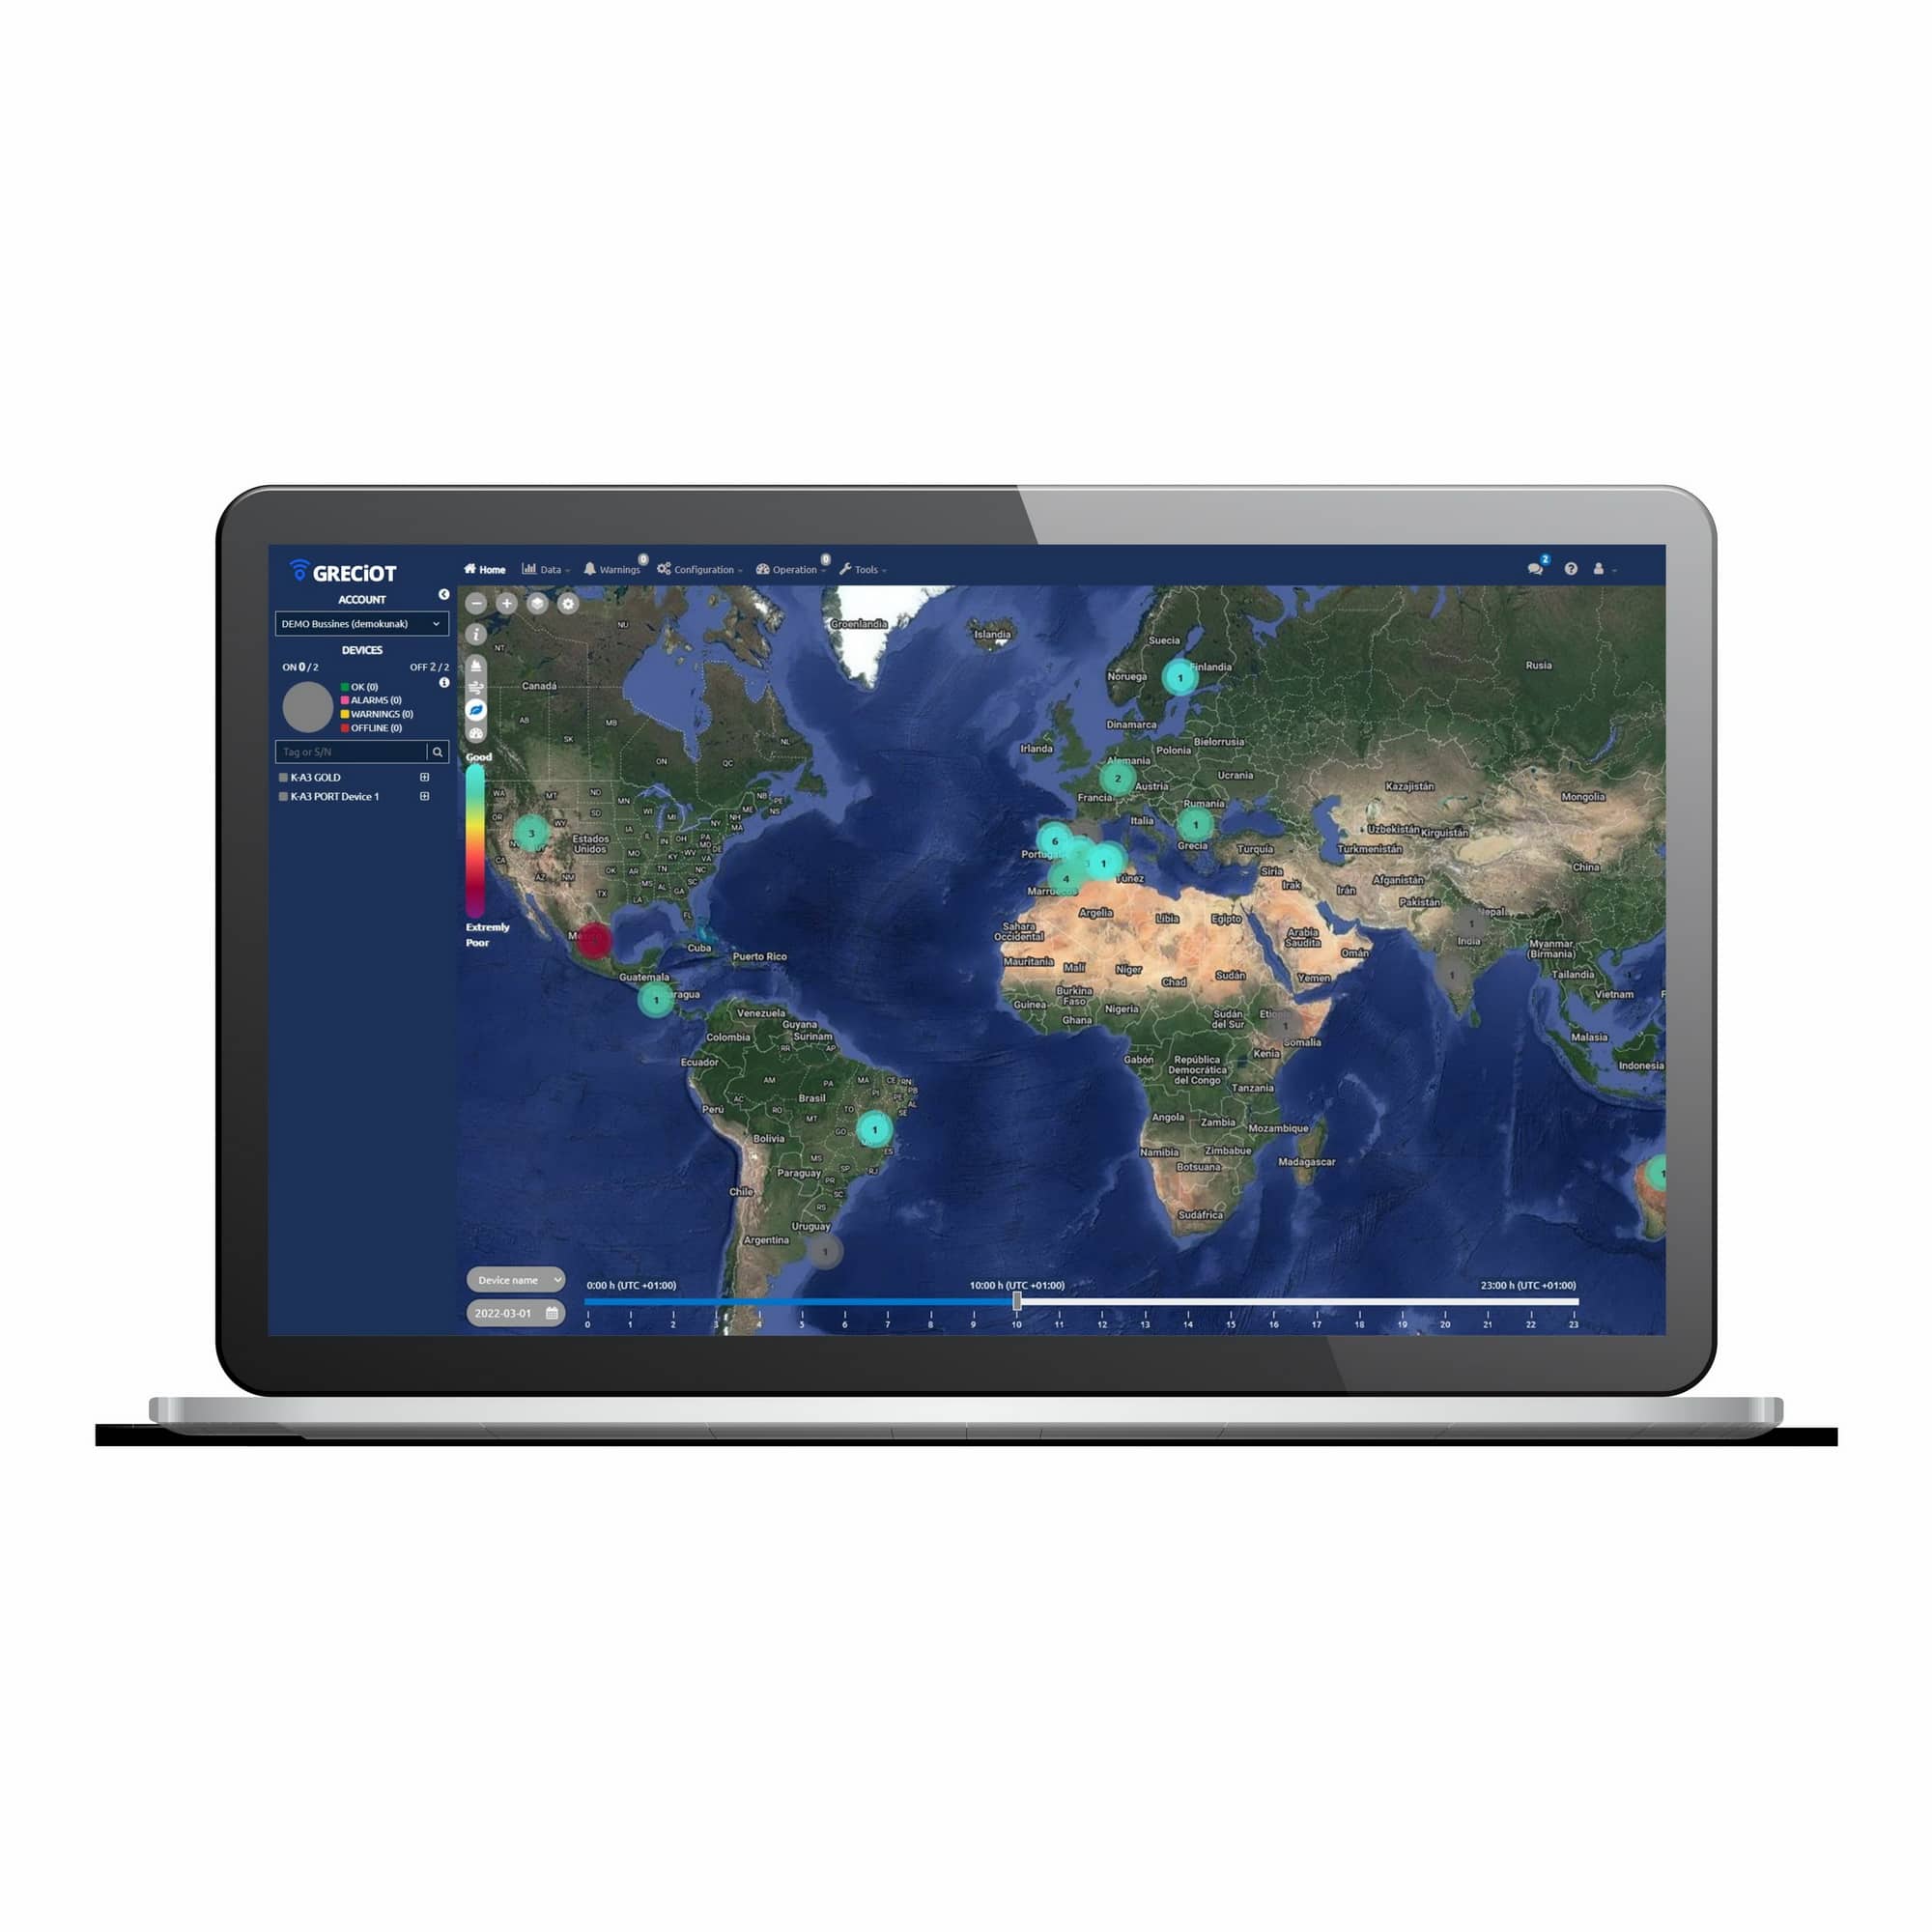
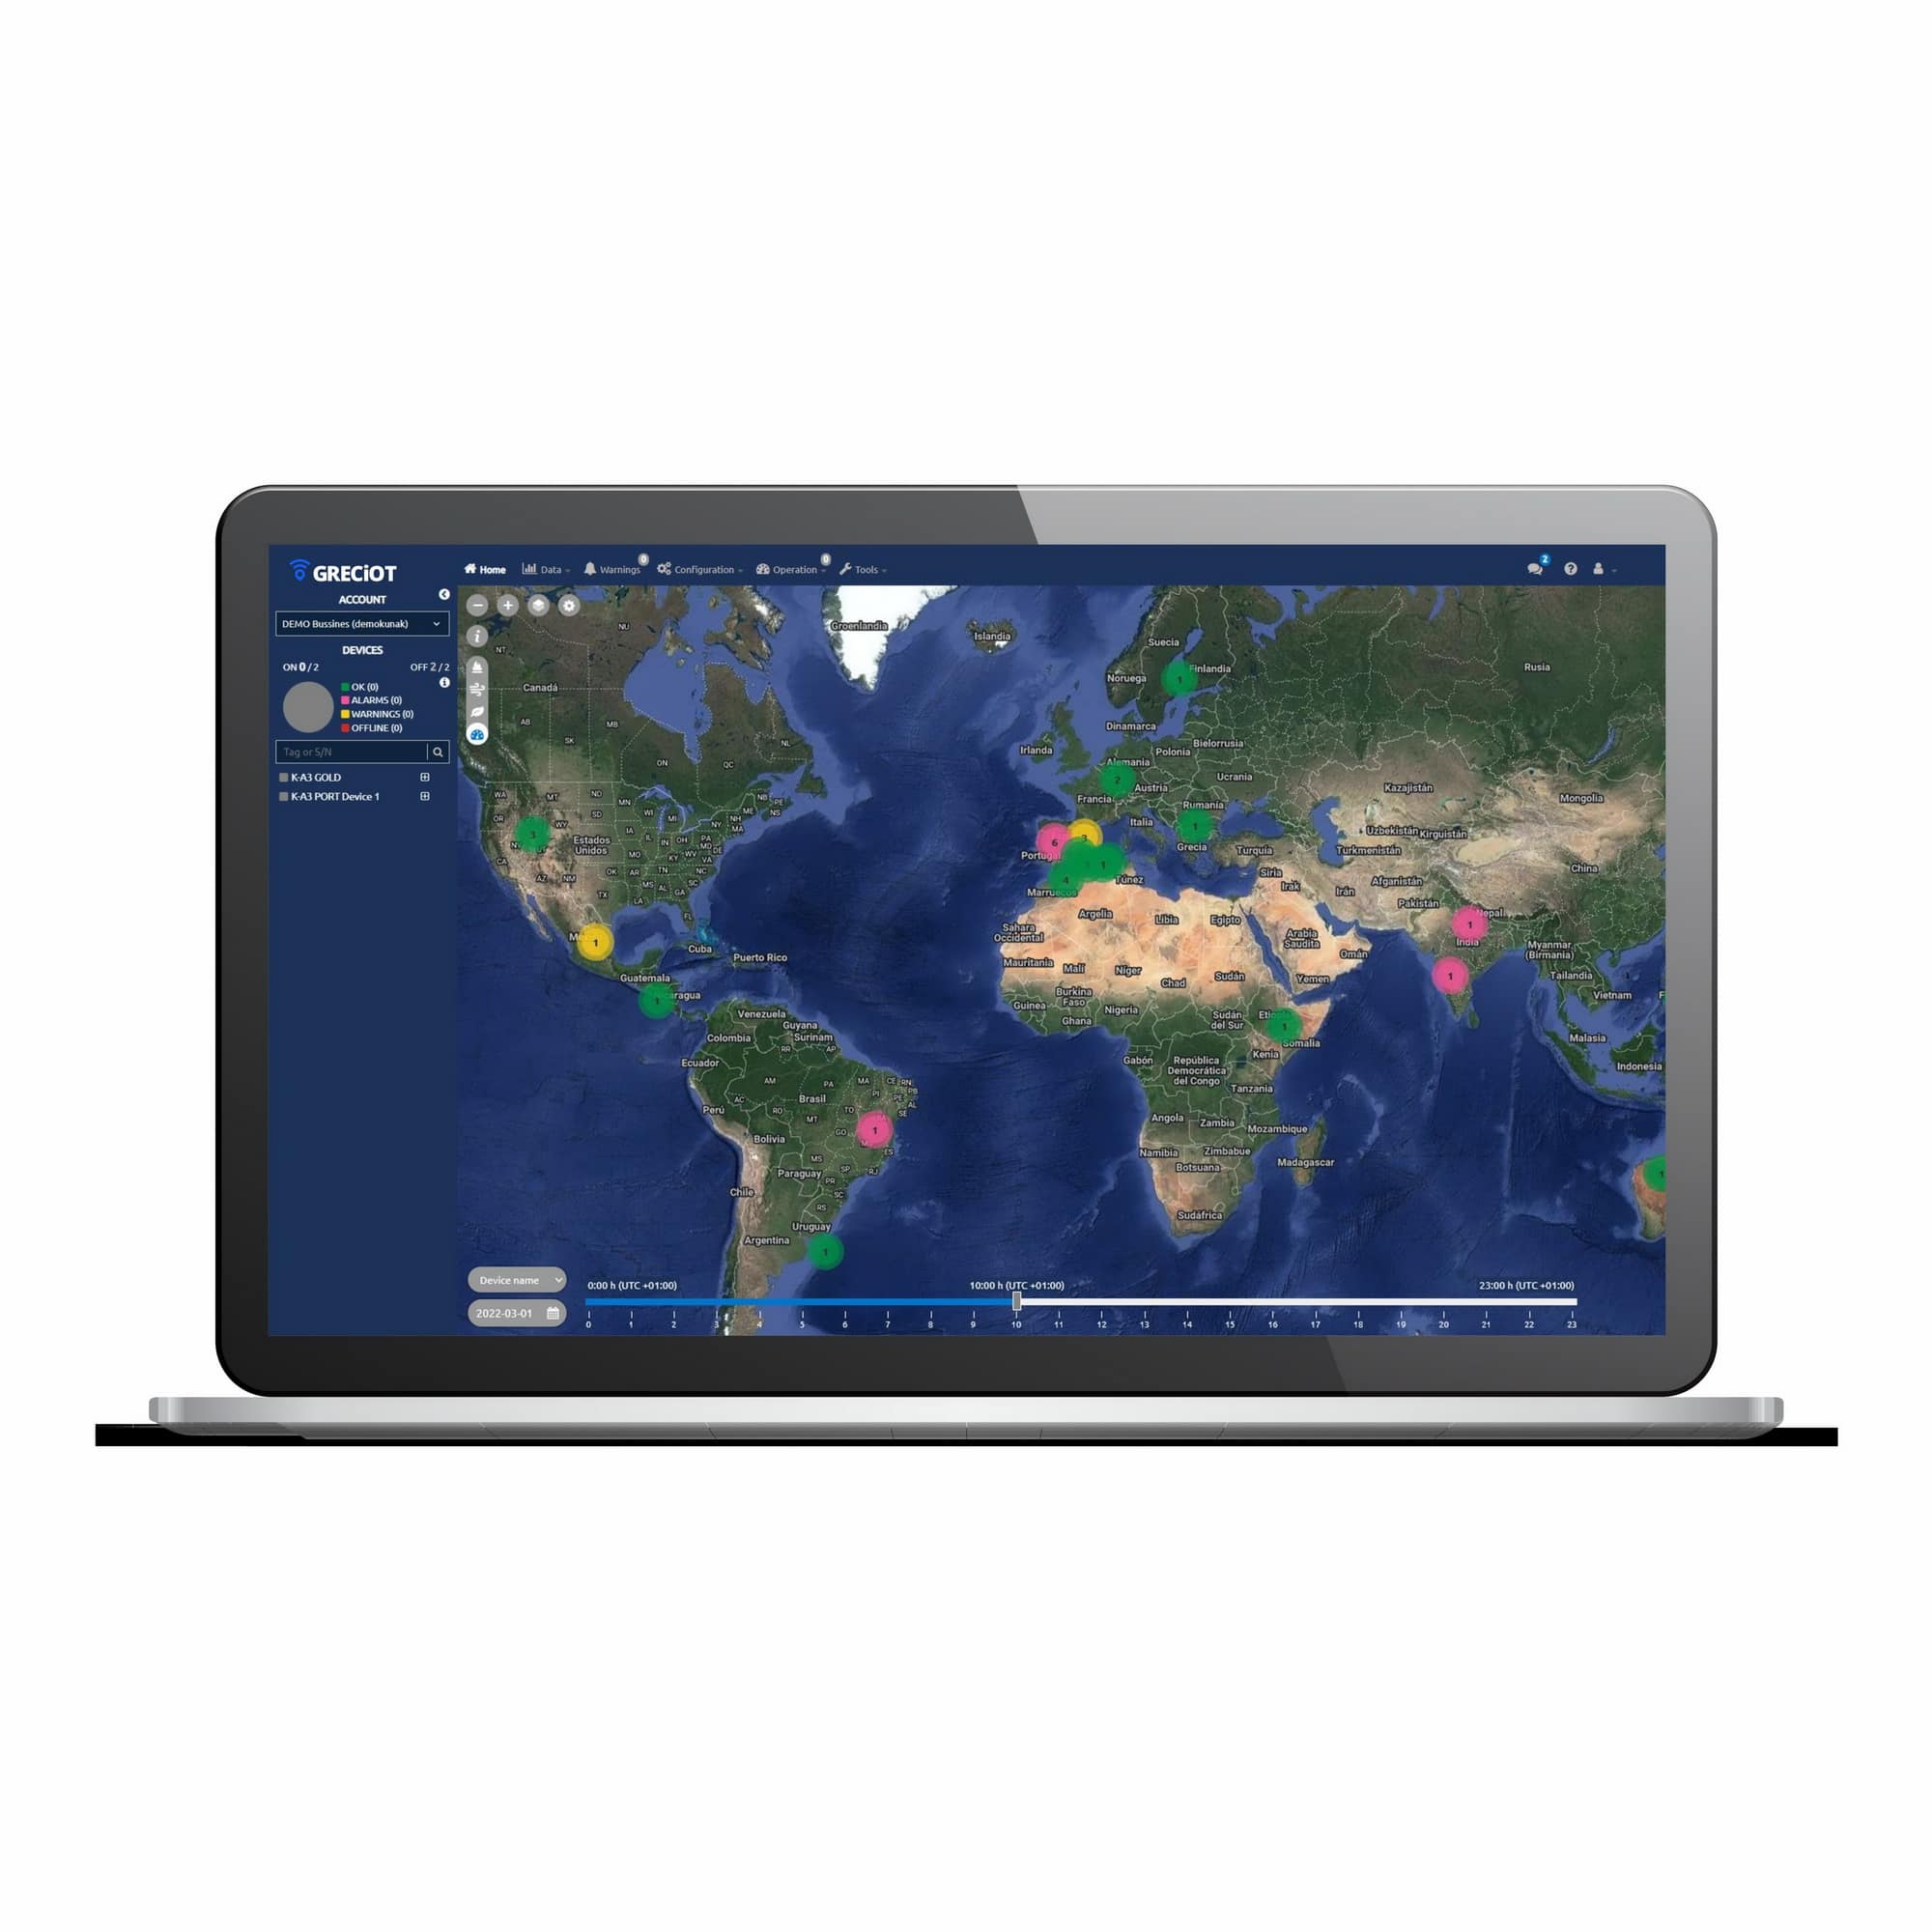
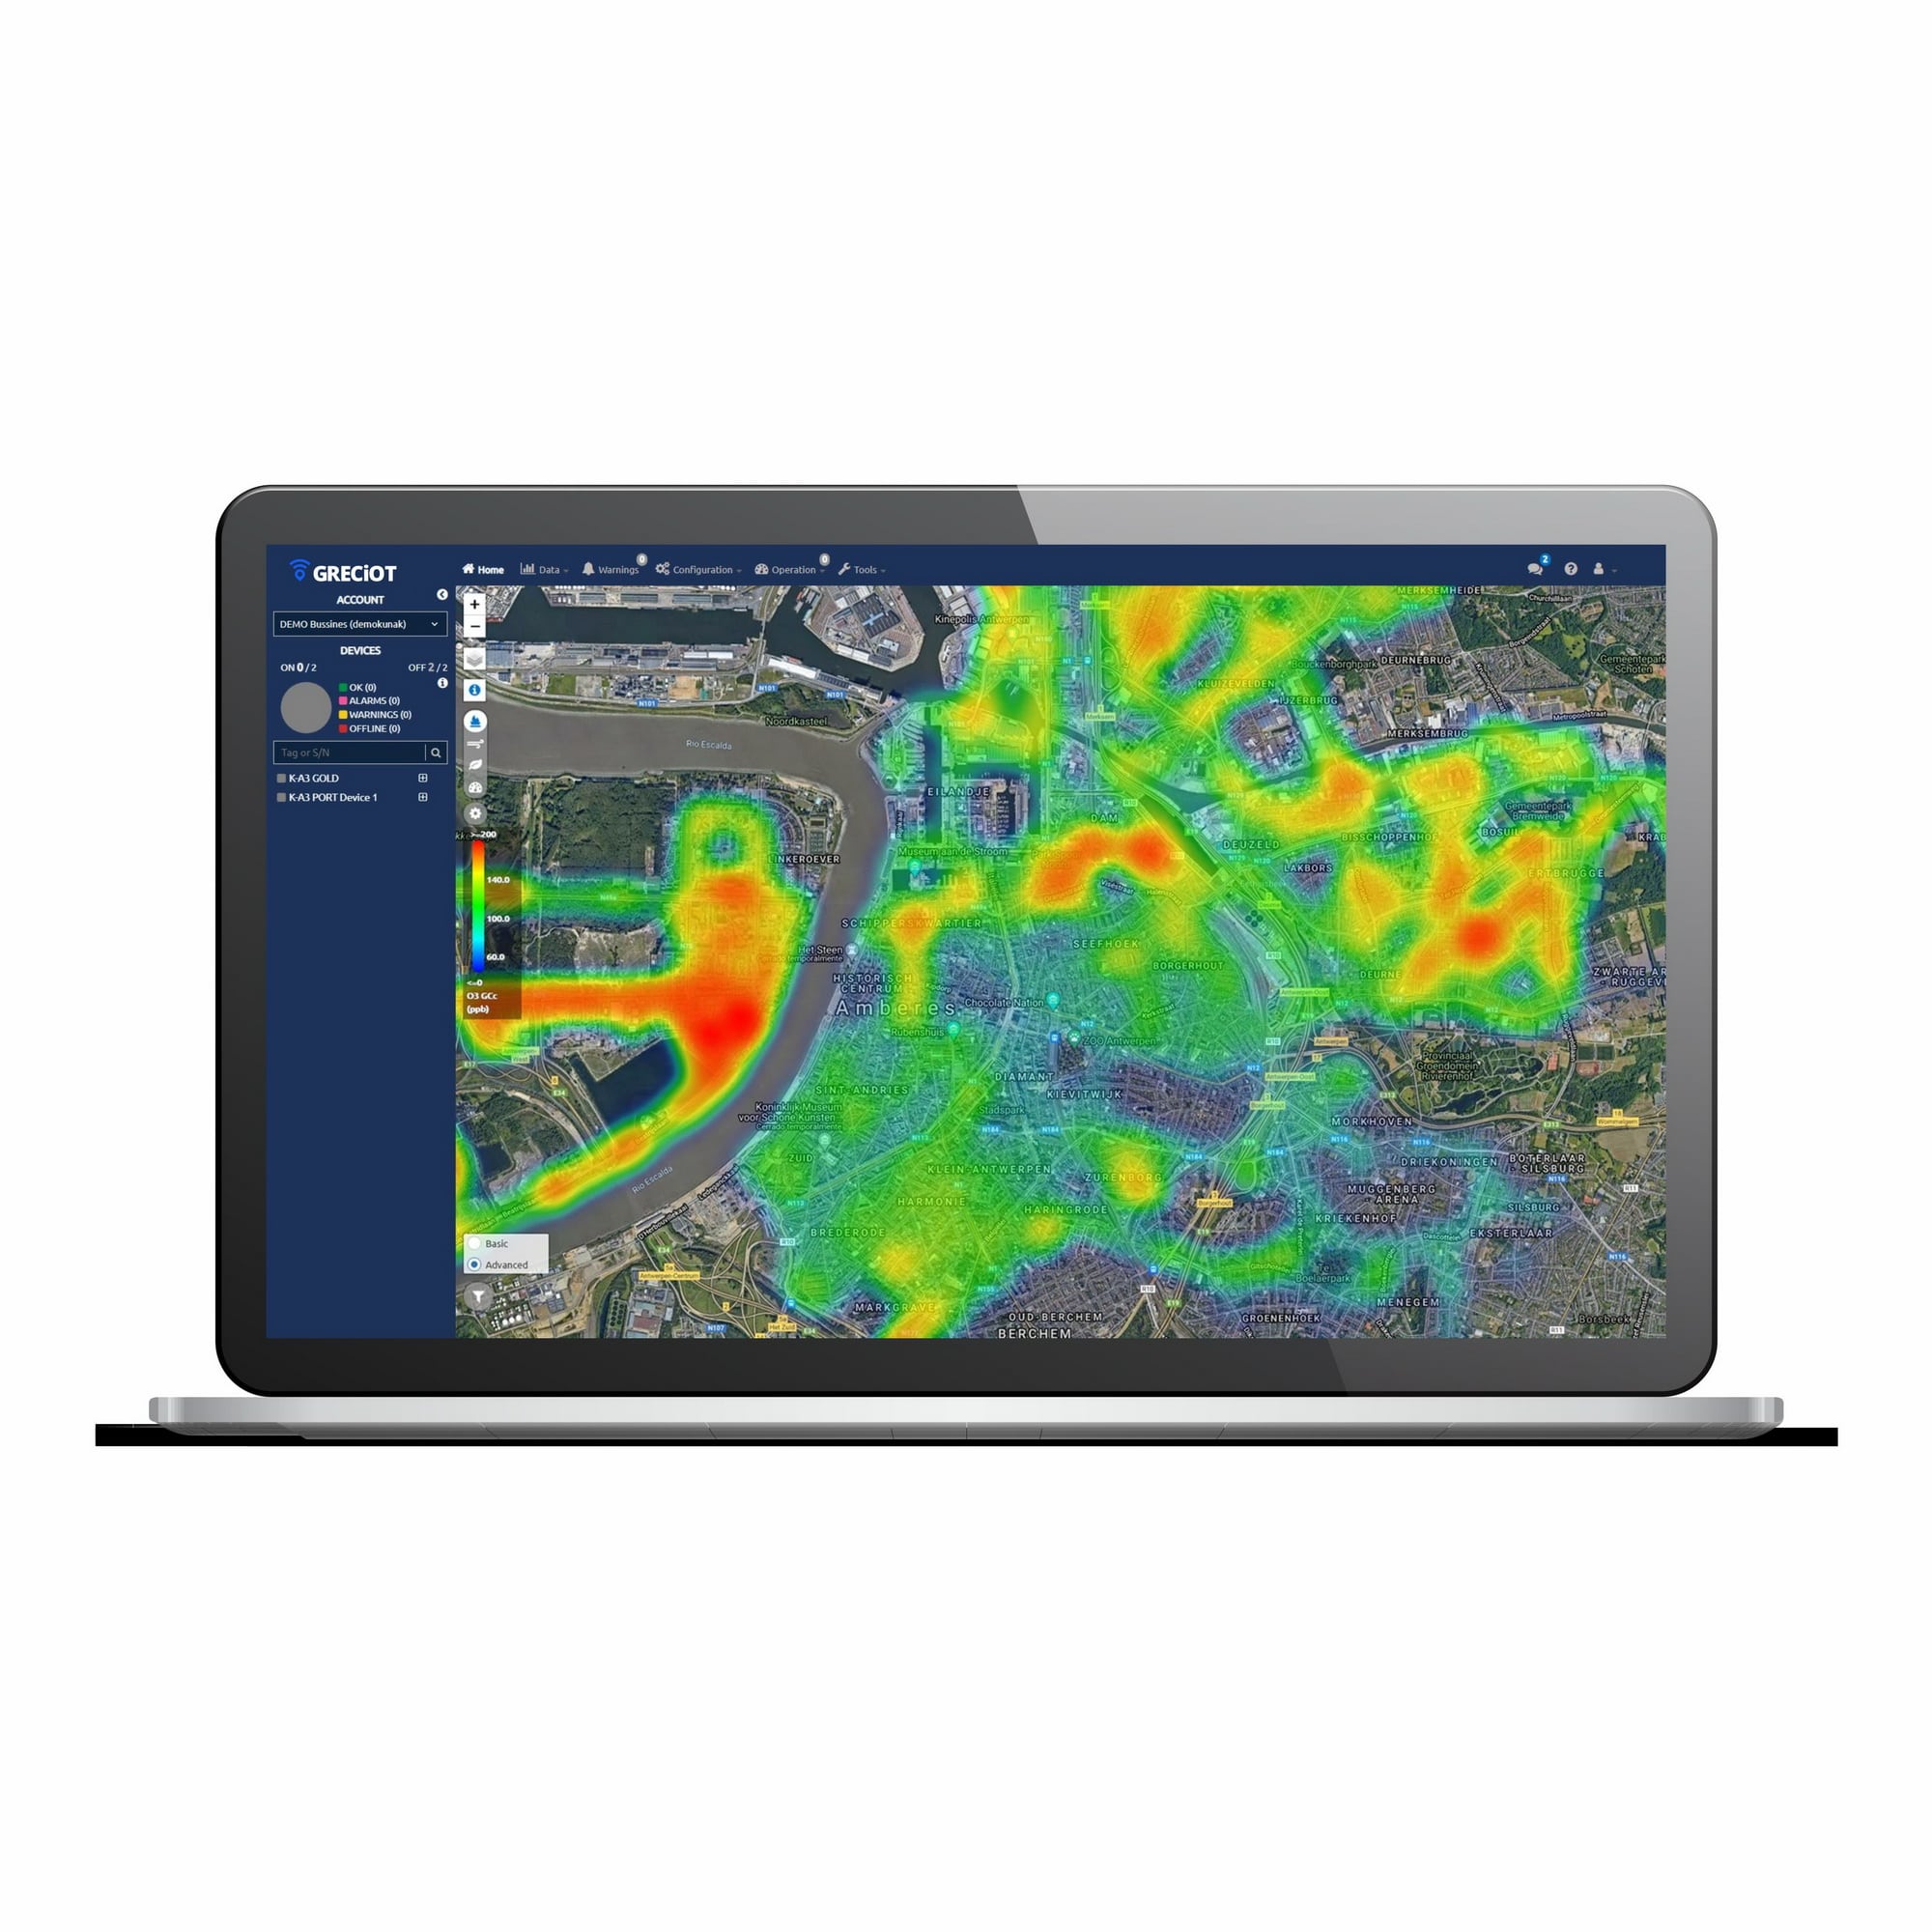
Pollution sources & Hot spots
Powerful air quality tools and advanced data visualization over the map.

Remote troubleshooting
Service, diagnose and troubles- hoot your stations remotely. Get remote support from our team.

Data sharing & Integration
Share the collected data via API or export in different formats. Insert data from 3rd party devices.

Public Air Quality Data
Create public web portals and widgets to share air quality data with stakeholders.

STARTER
The best option for just vi- sualize your data, AQI, and configure your devices, while our team help you operate them*.
STARTER + OPERATION
To keep track of the devi- ces, an operator is needed and these tools will facilita- te its work. You will operate and maintain your network.
STARTER + ANALYTICS
Just visualize data is not enough? Have access to the most advanced data analysis tools. Our team will operate and maintain your network for you*.

FULL
Oriented for those who want to perform all servi- ces that involve obtaining the highest quality of sen- sor data.
.pdf")
Starter
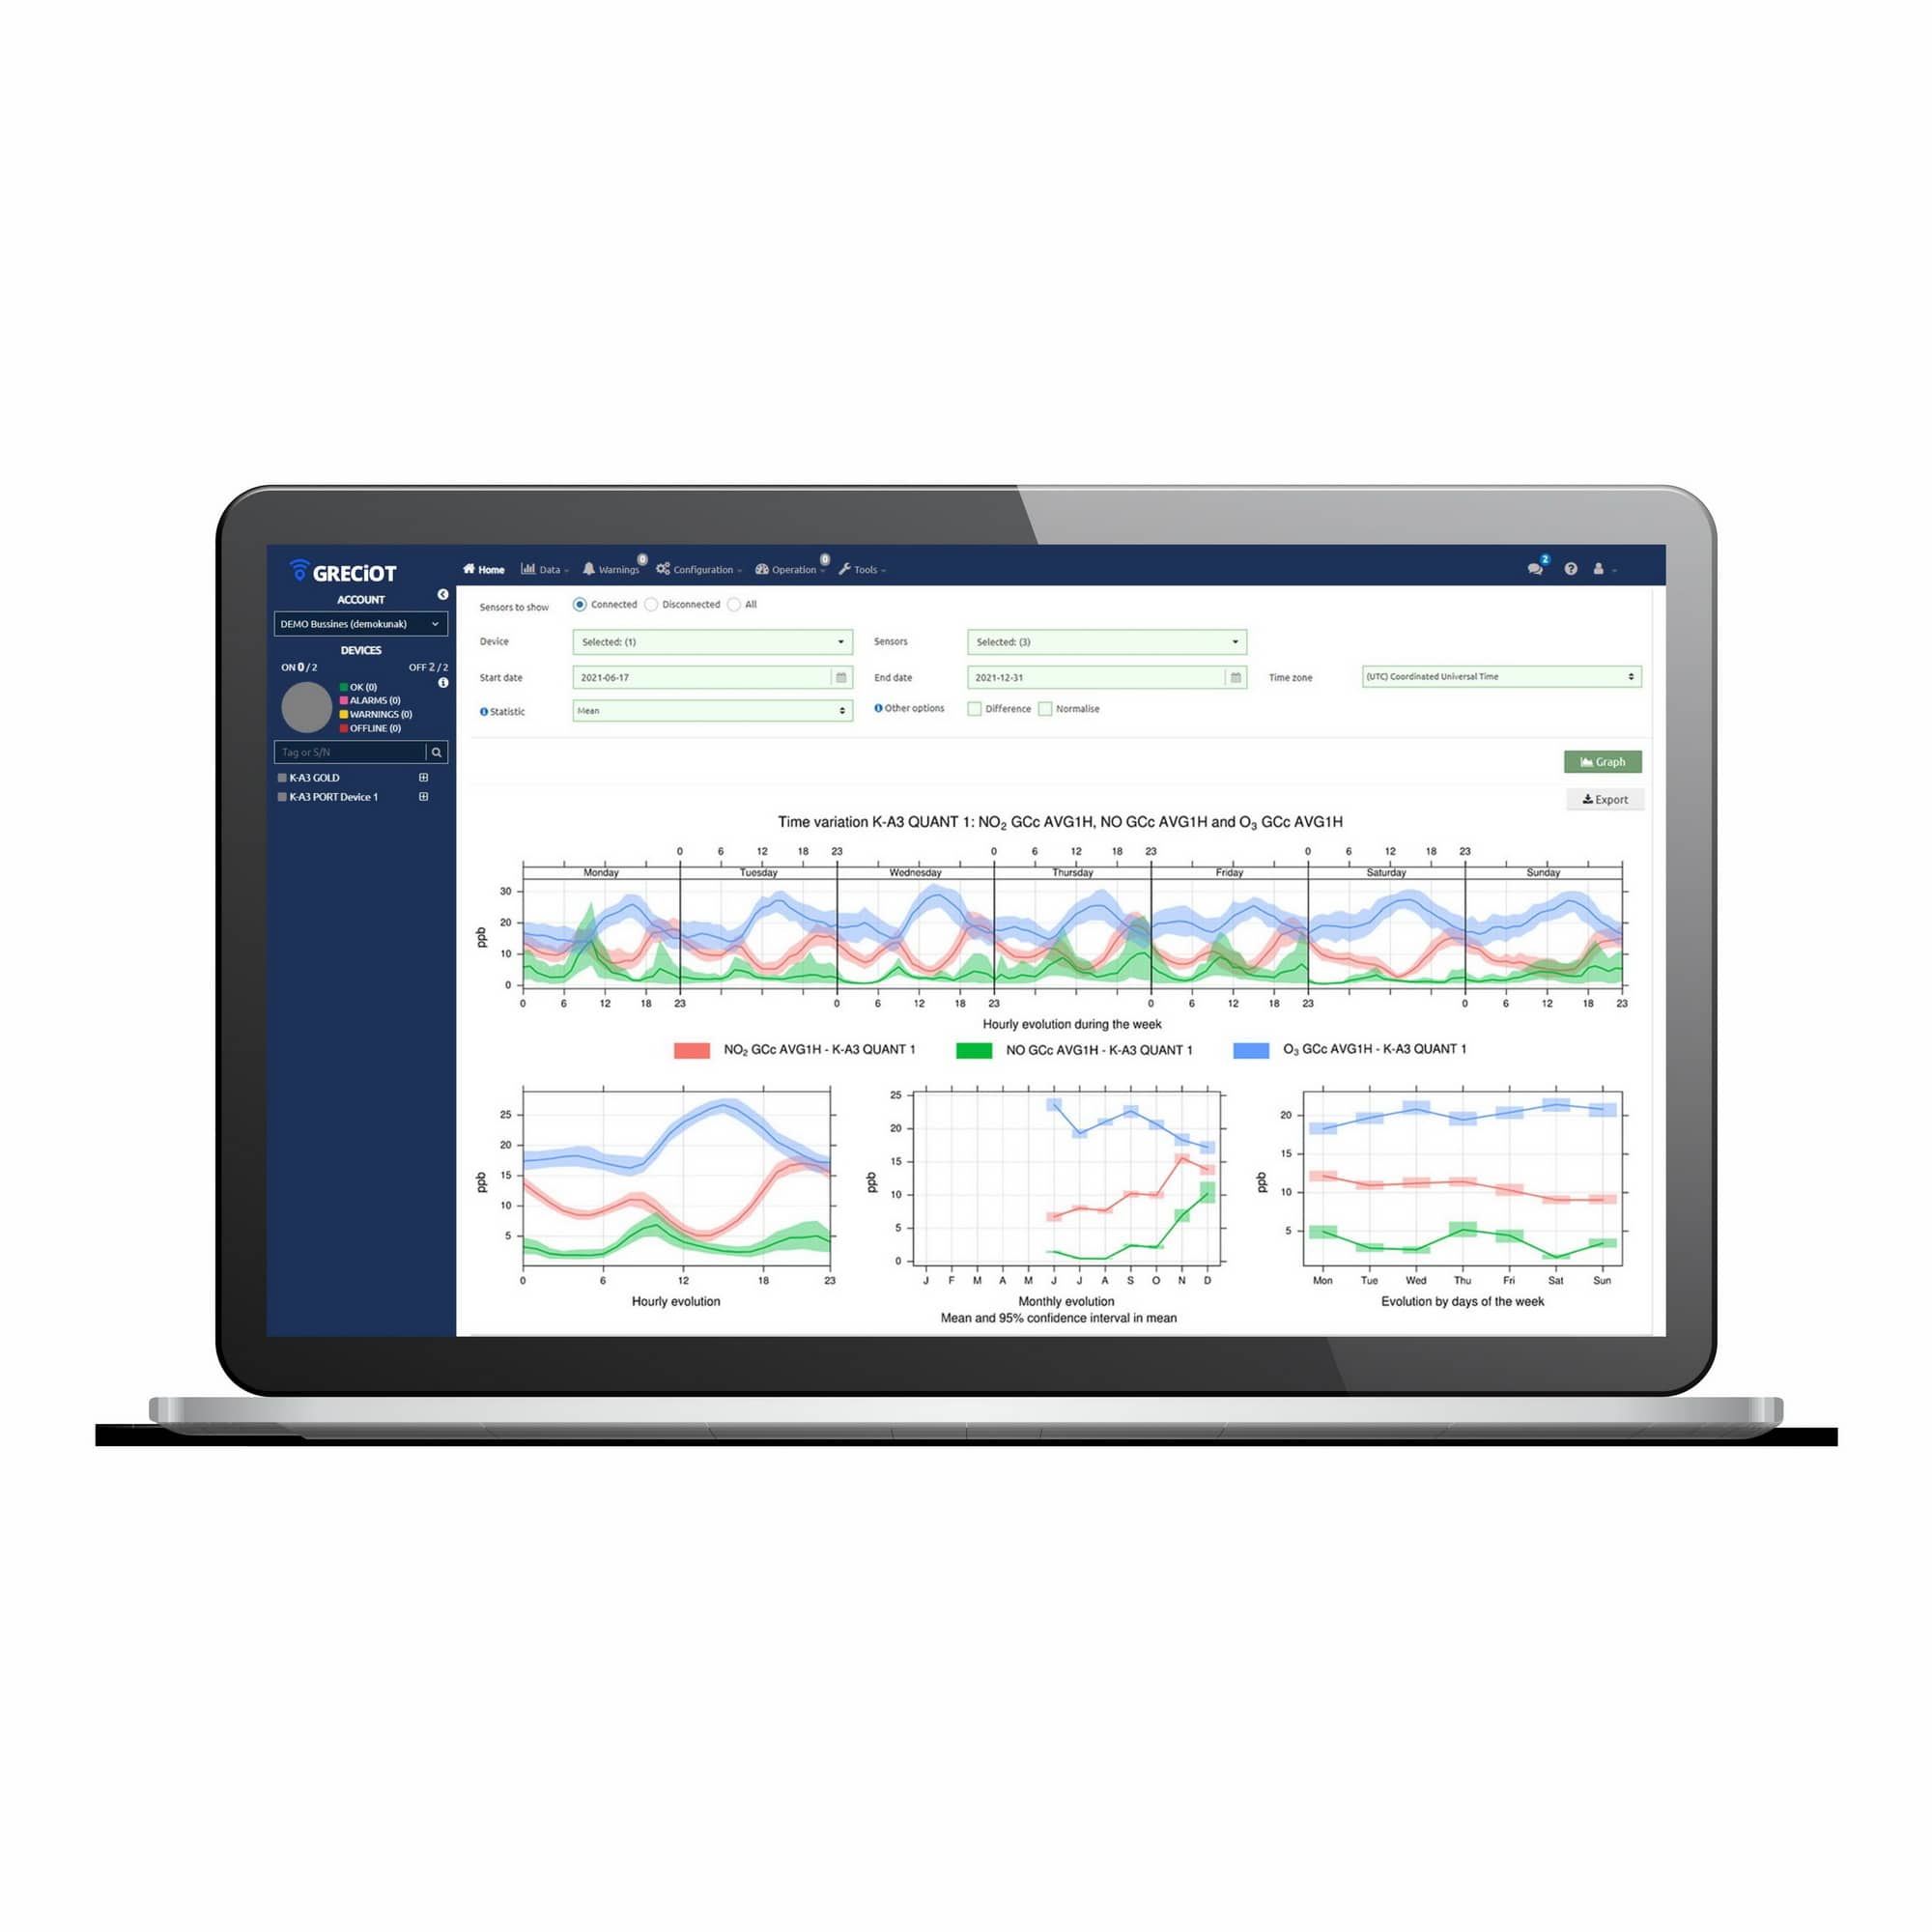
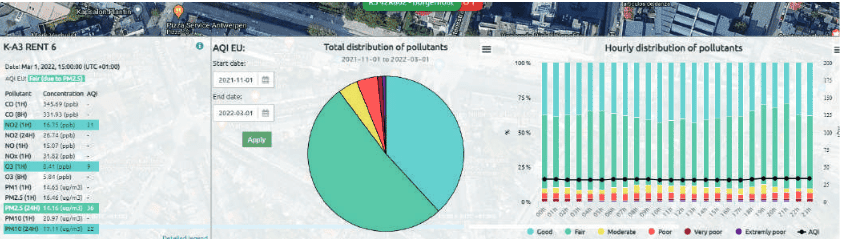
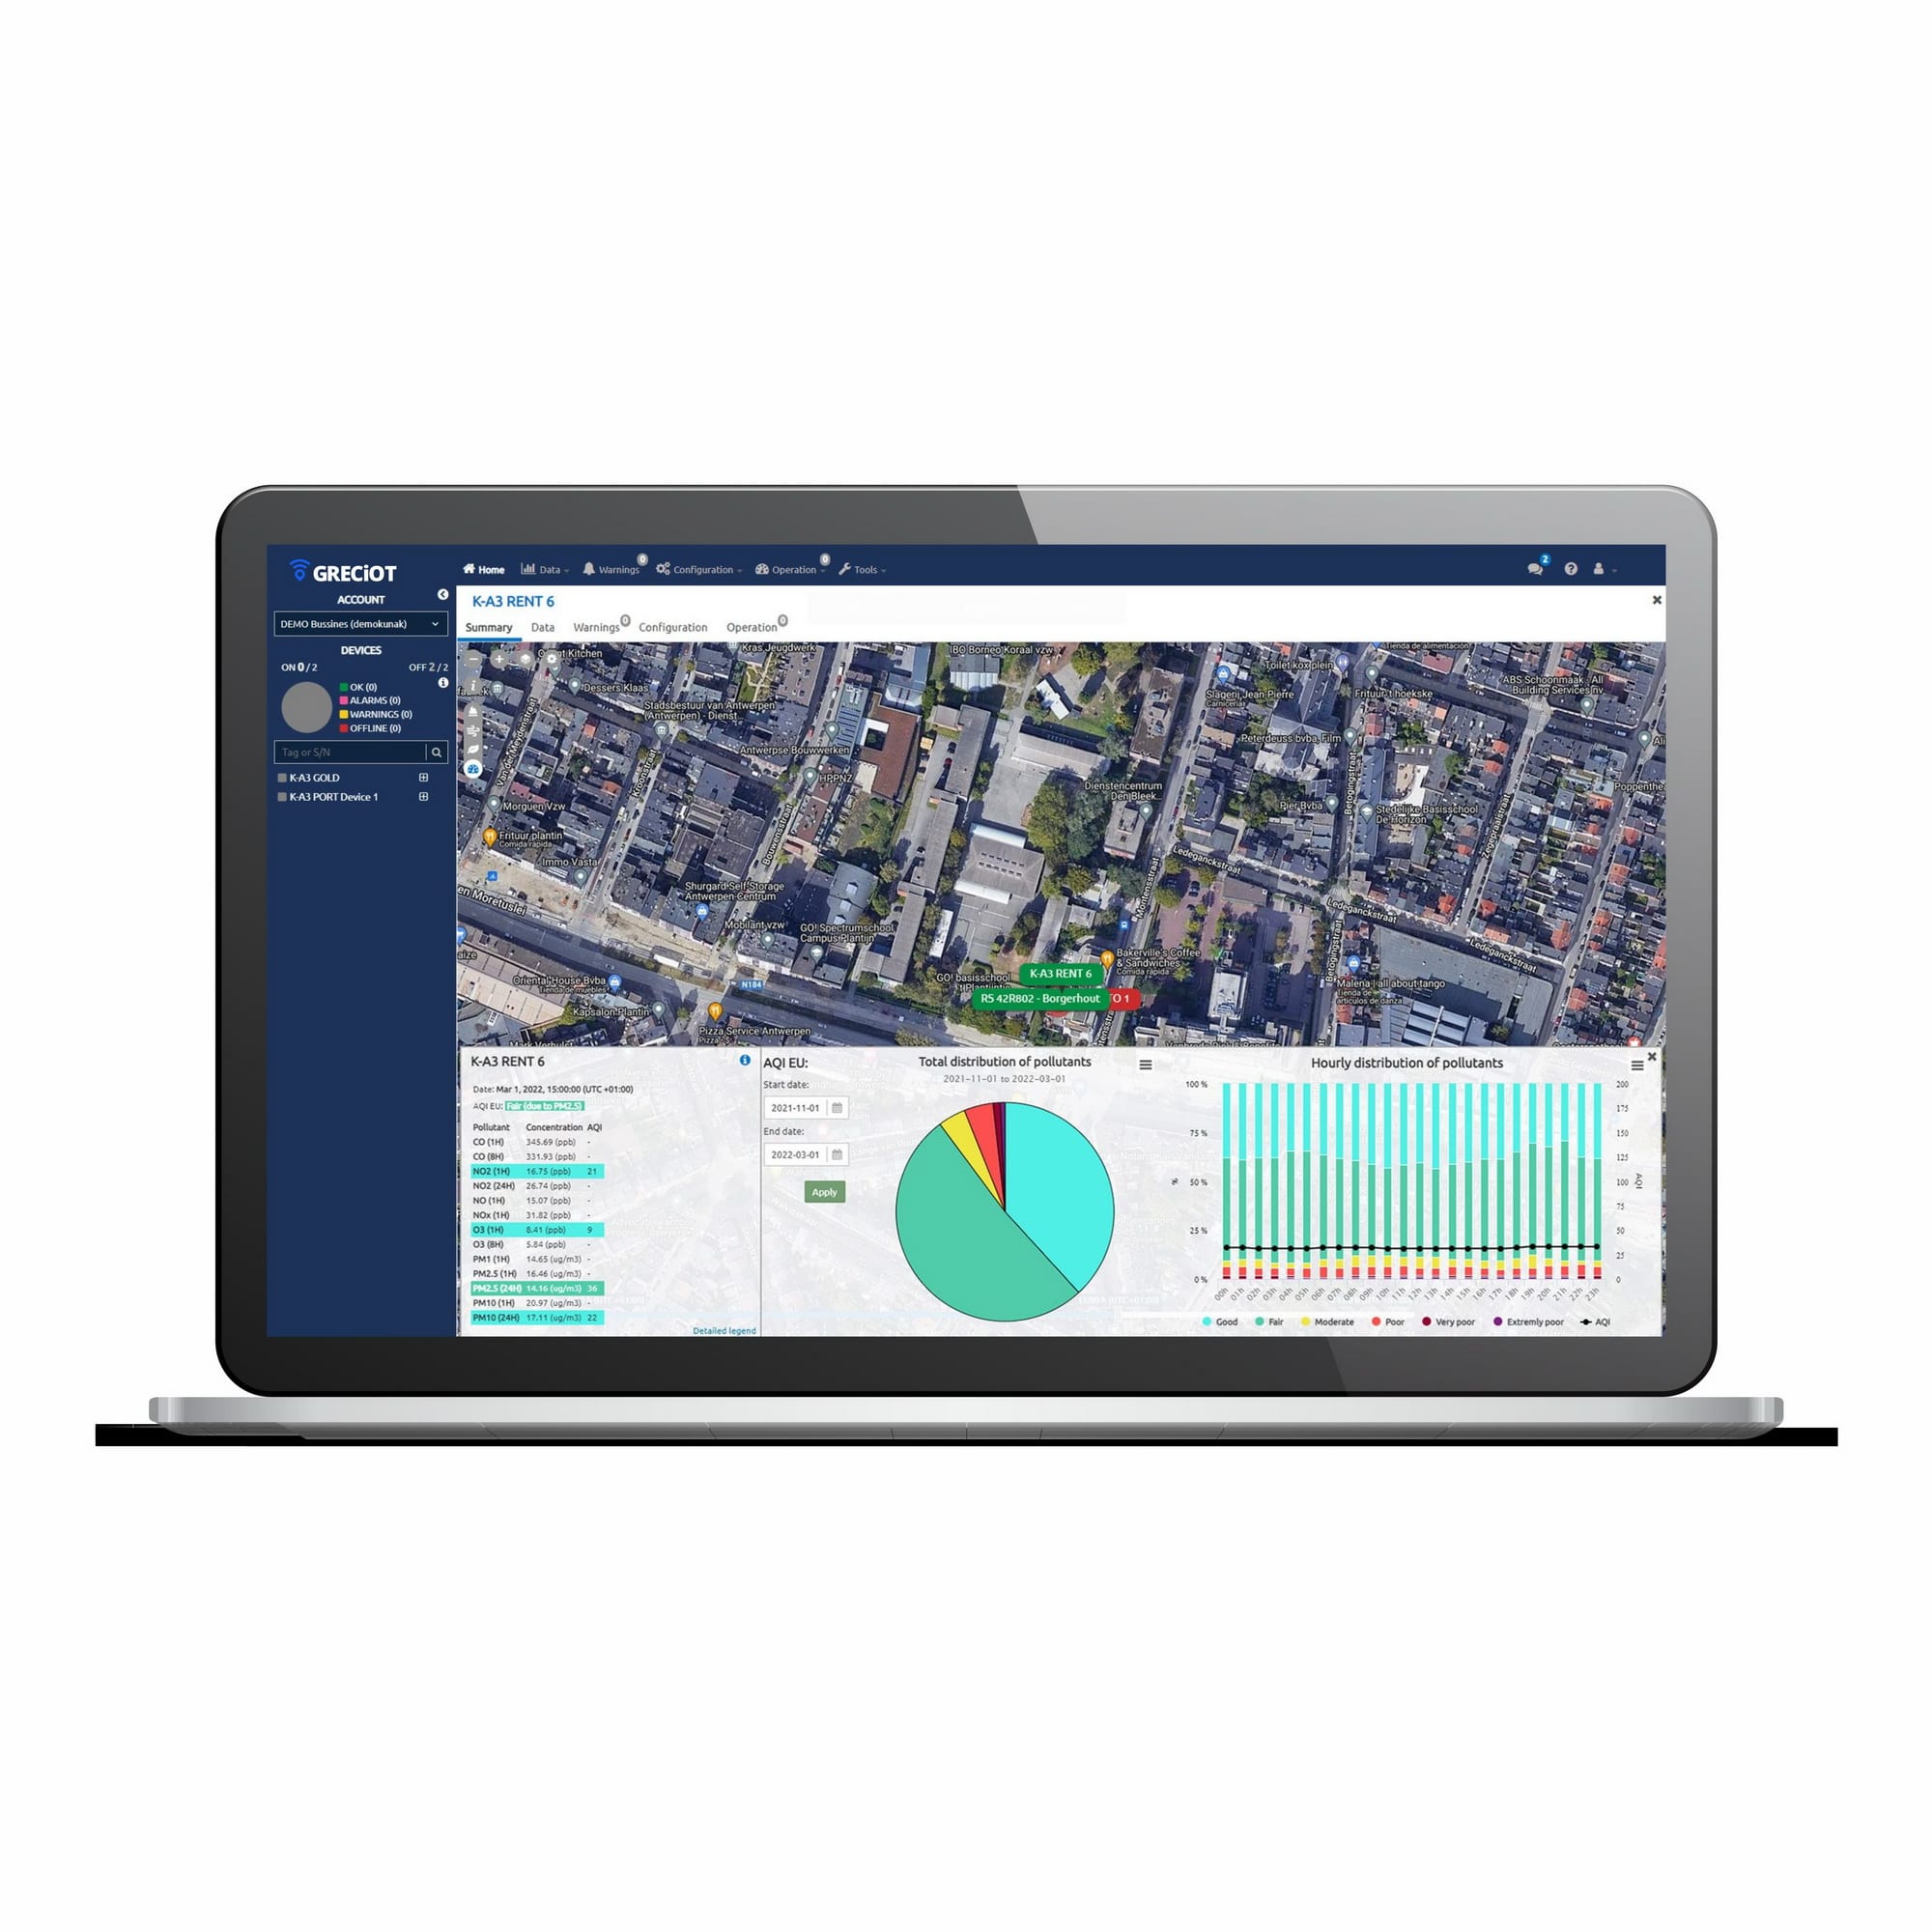
Dashboard to overview the health of your devices and sensors. Easily visualize your real- time data, check temporal graphs and get basic statistics. Obtain reliable data thanks to automatic data flagging.
- Check your devices on a map, their operational status, and last
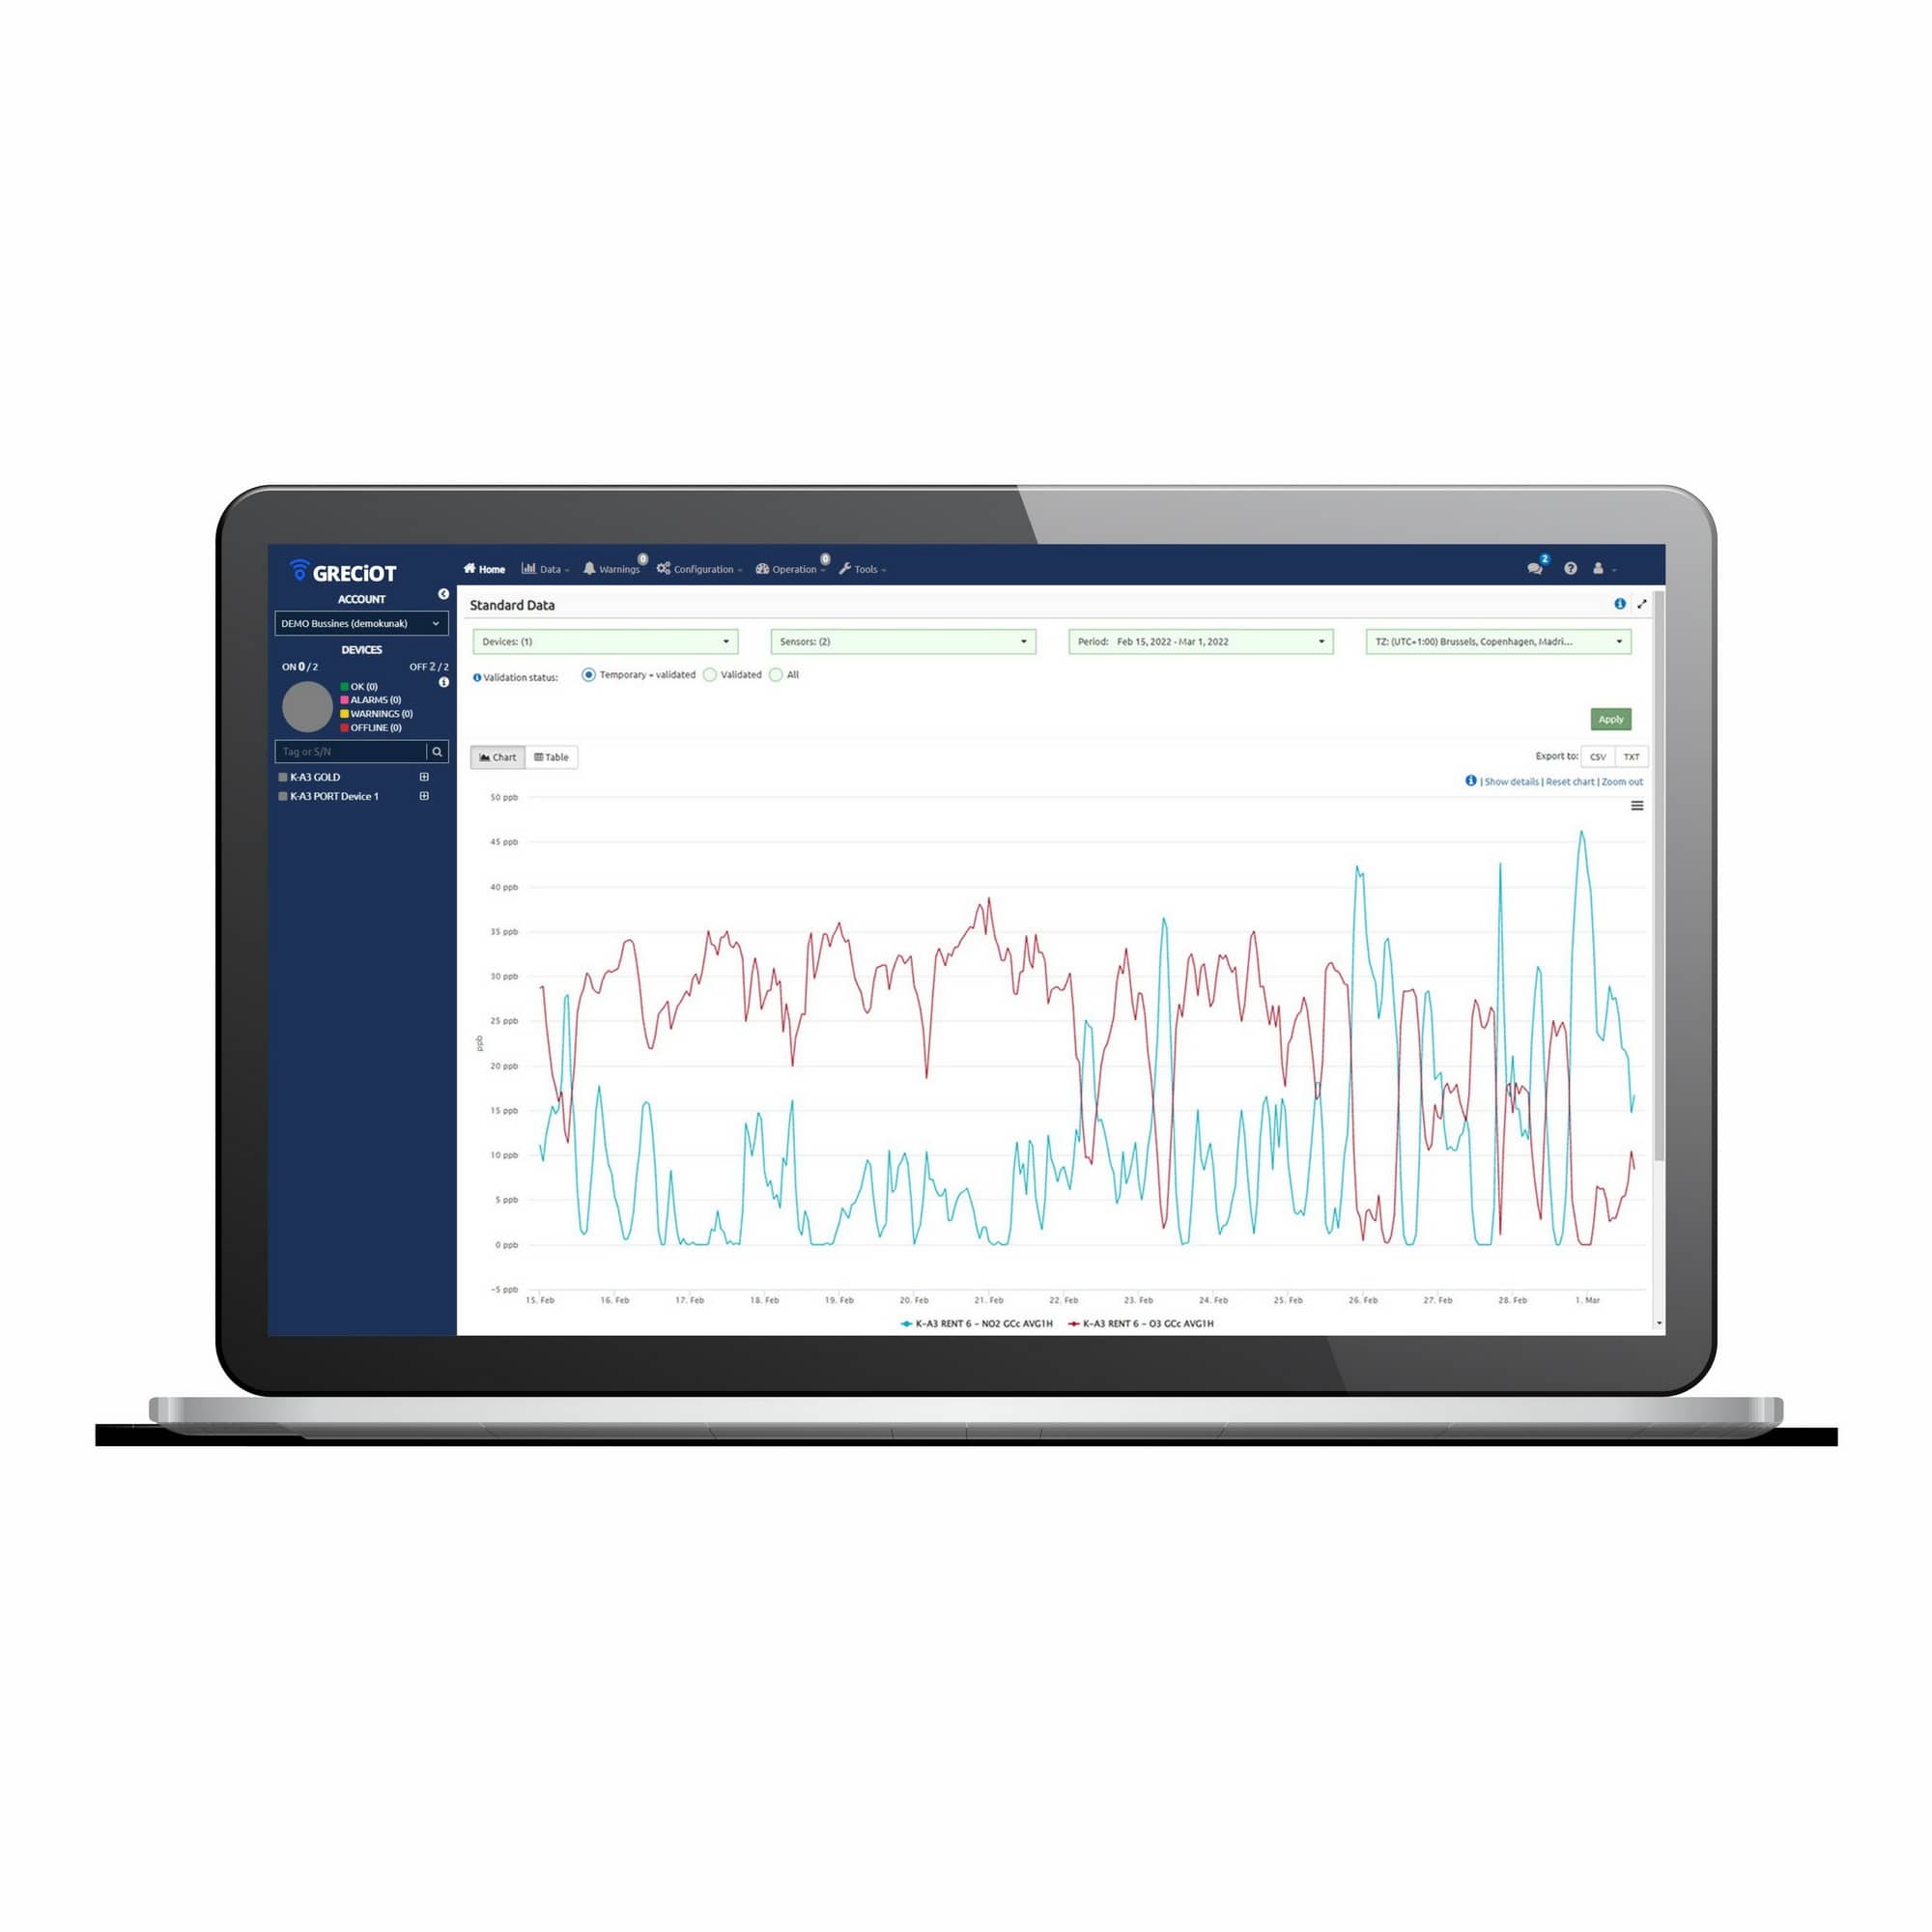
- Standard data visualisation, hourly/daily average calculations and basic statistics to show in a fast way all the data measured by your
- Export your data into CSV or TXT files
- Air Quality Index (AQI) tool according to different scales: EU, US EPA, Spain, India,
- Automatic pre-invalidation of the data under devices or sensors
- Remote configuration of warnings for exceeding
- Bidirectional communication for remote configuration of the devices and remote fir-
mware update.
.pdf")
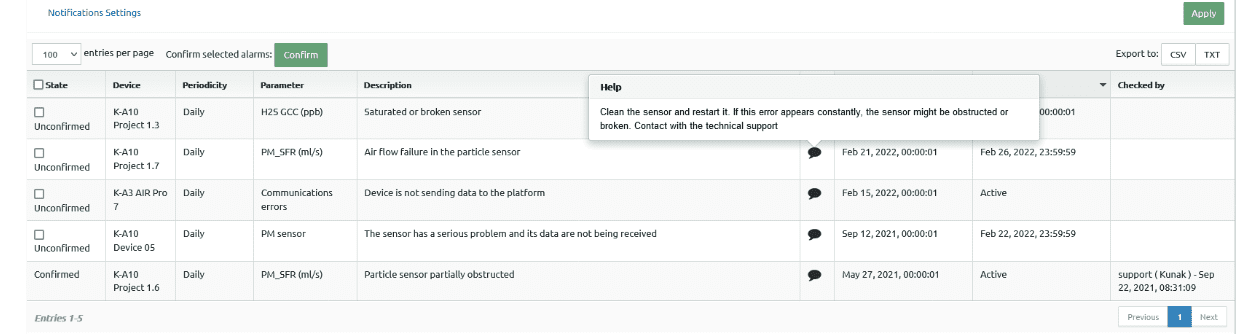
Operation
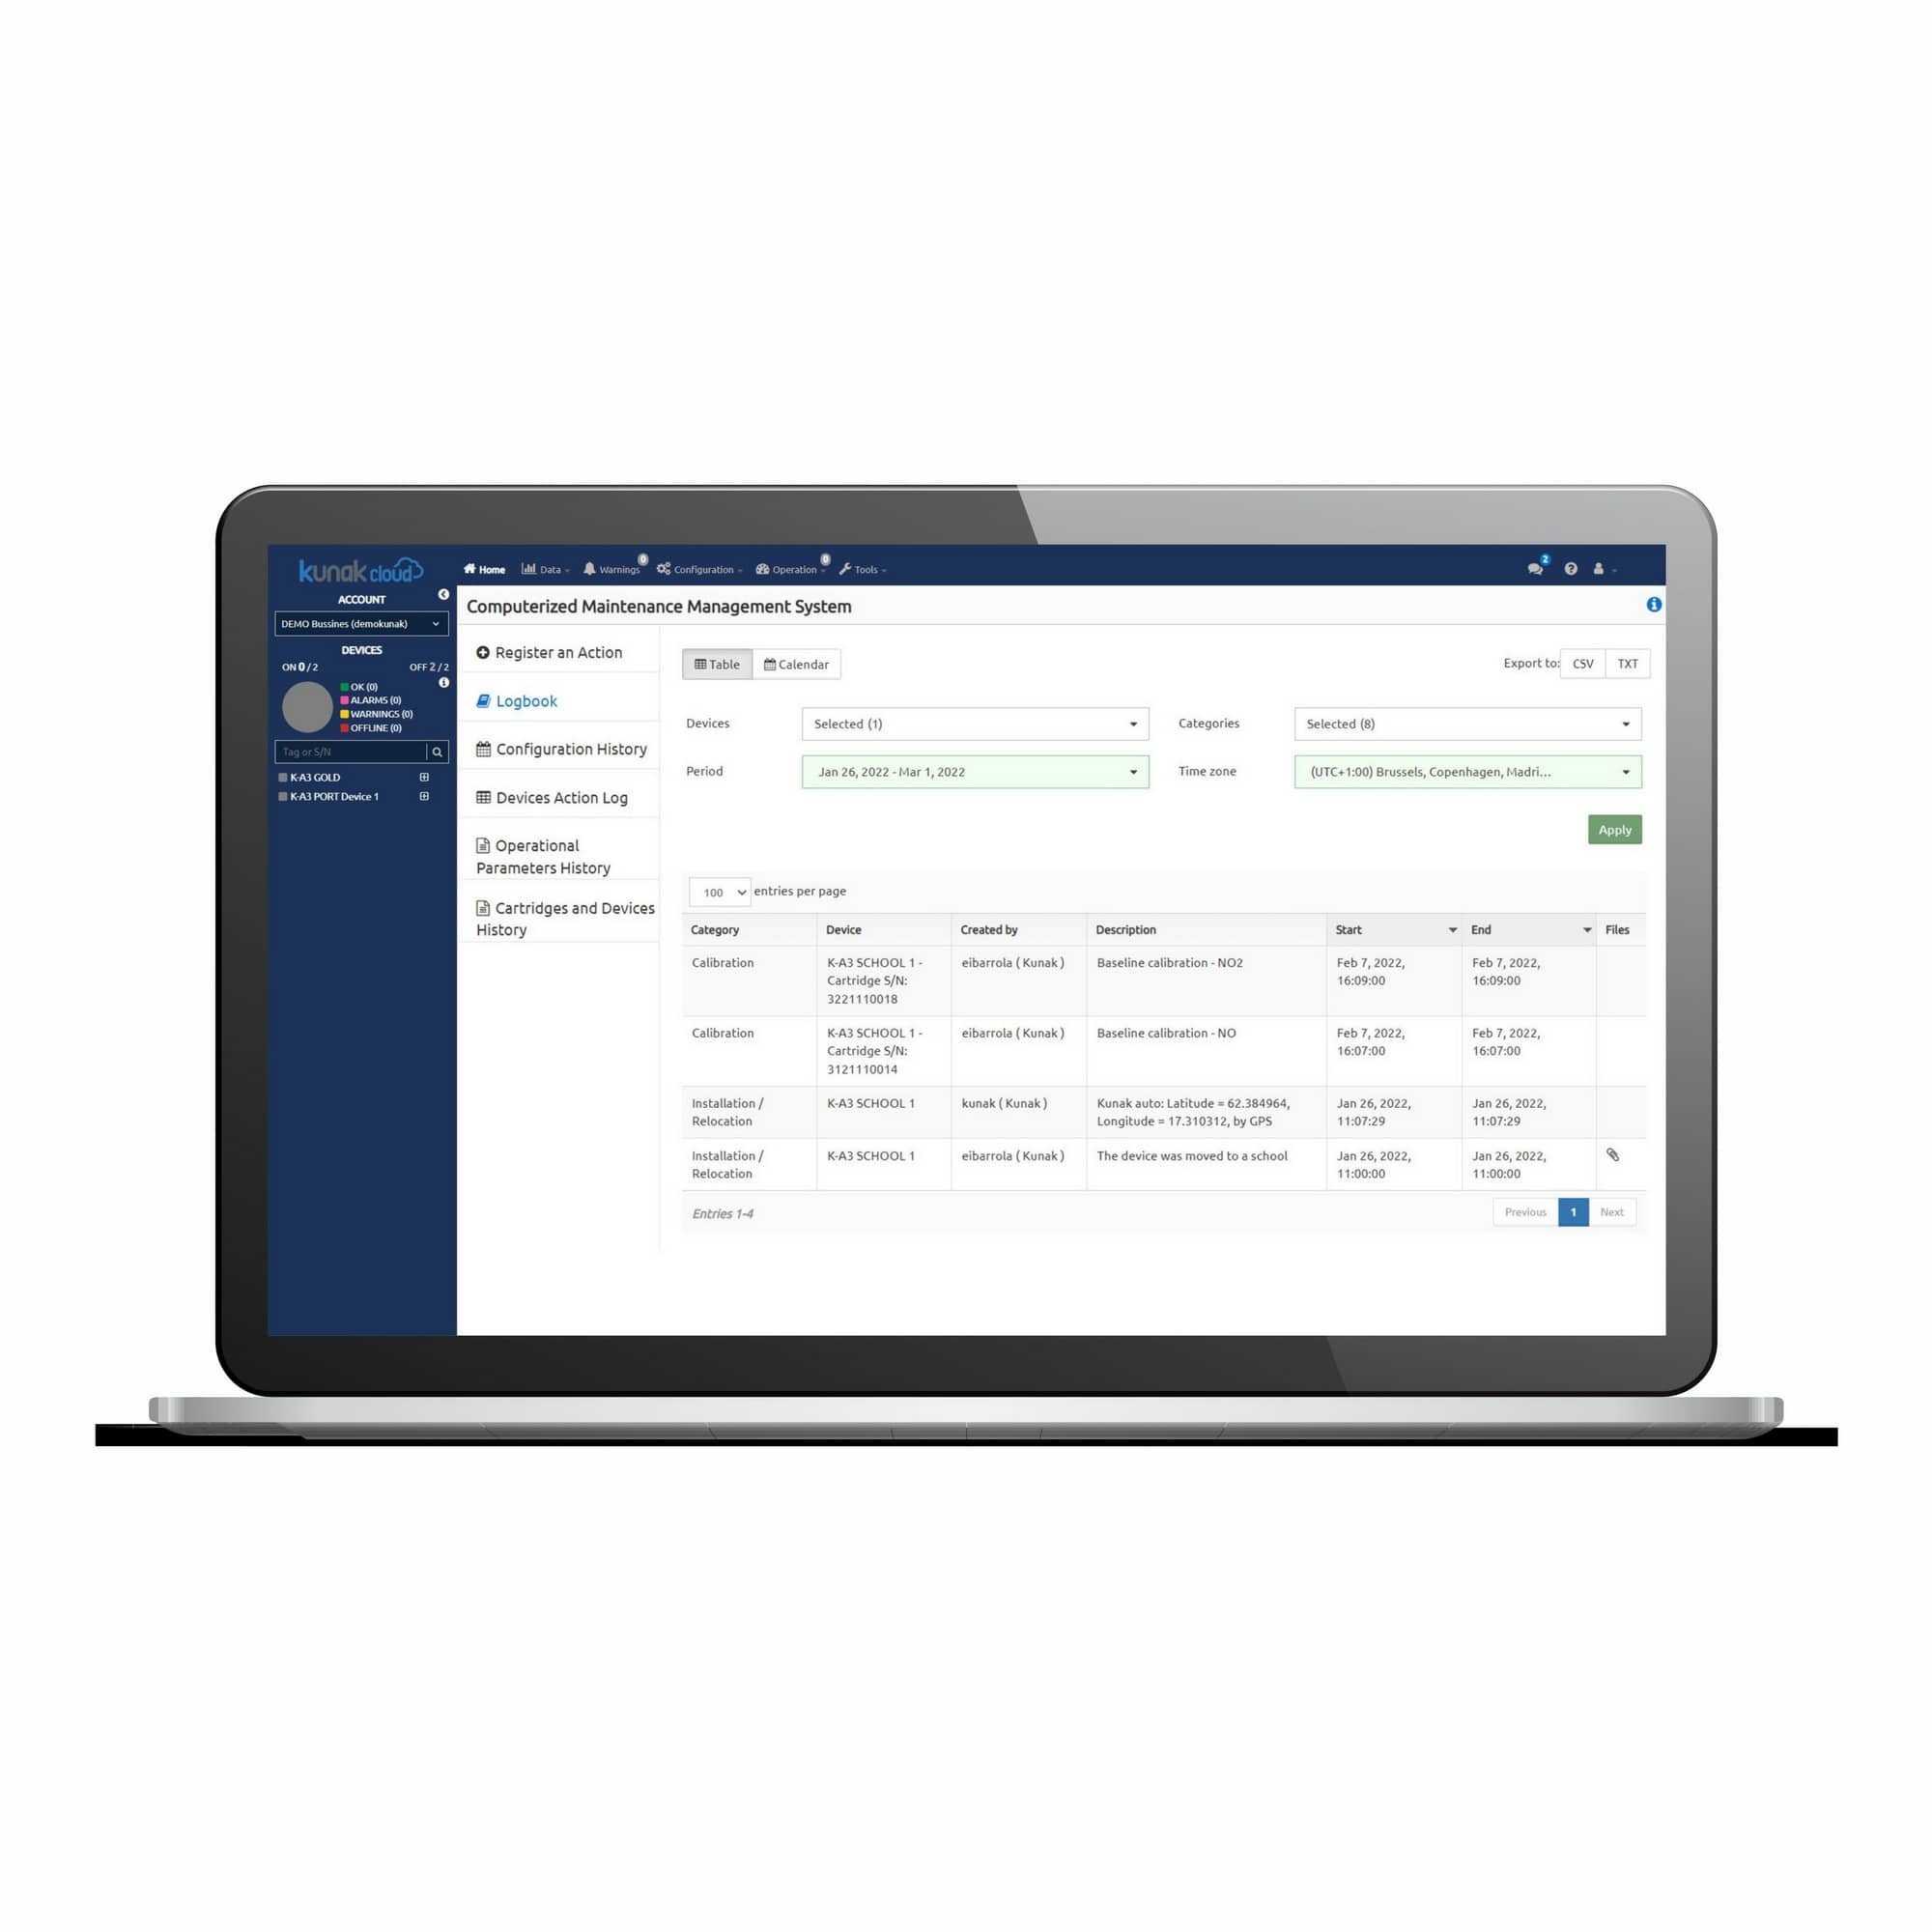
Assure the well-functioning of your network and get the best data accuracy thanks to the embedded automatic supervision algorithms. Confirm operation alarms (sensor mal- functions, devices problems…) and consult the online suggestions to troubleshoot the detected issues while controlling all the actions carried out in your devices through the CMMS tool.
Automatic errors and anomalies detection in the devices, sensors, and data immedia- tely, notifying them and proposing tips to solve the issue.
Detect gas and particulate sensors de-calibration. Calibrate your gas and particle sen- sors remotely thanks to the Calibration Tool.
Computerized Maintenance Management System (CMMS) to facilitate the mainte- nance of the devices, register any maintenance work, upload photos and documents, configuration history, activity journal, etc.
Manage your air quality data by locations assigning devices to specific spots.
.pdf")
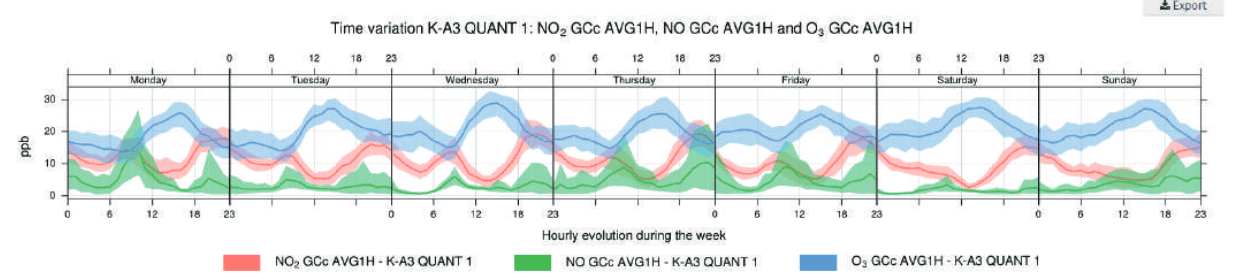
Analytics
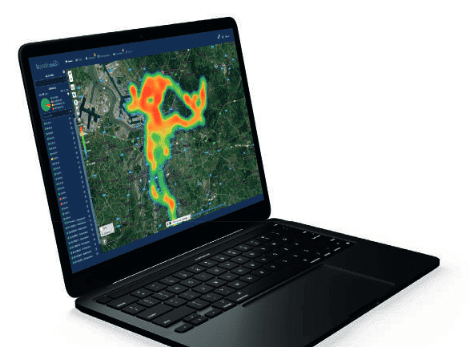
Get the most out of your data by validating your measurements and using the advanced analytics of the OpenAir suite. Detect source emissions and hotspots thanks to the tools which show advanced wind graphs and heatmaps on the map. Create customized re- ports and export or share them with your clients or stakeholders online.
- Simple manual data Validation Tool to clean data sets and perform advanced analy- sis with reliable
- Advanced Analytics Tool from Open Air suite to facilitate data analysis, including calculation of basic statistics, AQI calendar plots and pollutant concentration calen- dars, pollutant time plots, temporal variation, wind plots and many
- Integration of other data sources in real-time or by file
- Easy tool to create your AQ reports automatically of a device and/or an entire network.
- Heatmaps to identify hotspots over a
- Time-varying heatmaps to know the evolution of hotspots over
- Pollution sources detection using pollution roses and polar plots directly on the
- Particle size analysis tool that includes size distribution graphs by mass and by
Software Plans

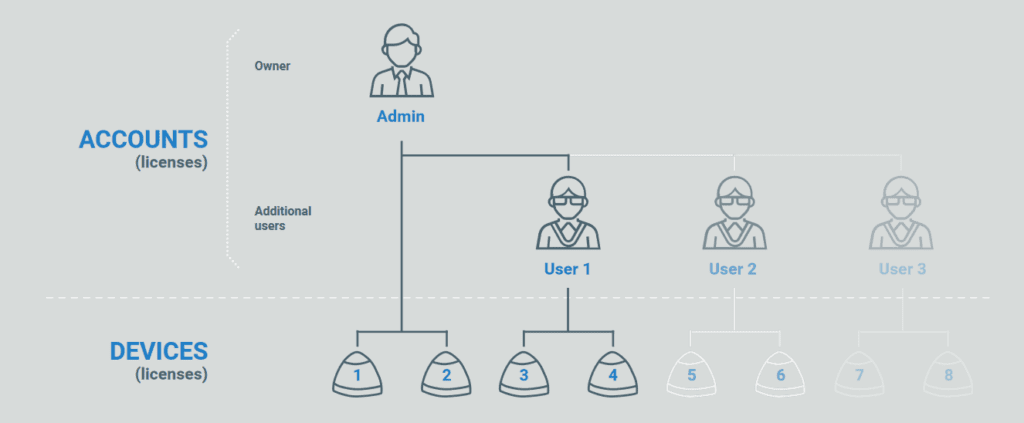
Get your Admin account (only required for the first time, billed annually)
Manage users and accounts, and easily manage the network; configure, operate, calibrate and maintain the stations, as well as validate and analyse data and create reports.
Choose the device’s package (one package per device is required, billed annually)
Select the licence package that best suits your needs and allows you to get the most out of the data provided by the sensor network. Choose between:

Add additional users according to your needs (optional, billed annually)
Always keep on track with diagnosis, operation and maintenance works; and have access to consult validated data, custom analytics and reports.
Easily manage the net- work; configure, operate, calibrate and maintain the stations as well as vali- date and analyse data and create reports.
Log in to Kunak Cloud (and start operating your network) Got to www.kunakcloud.com
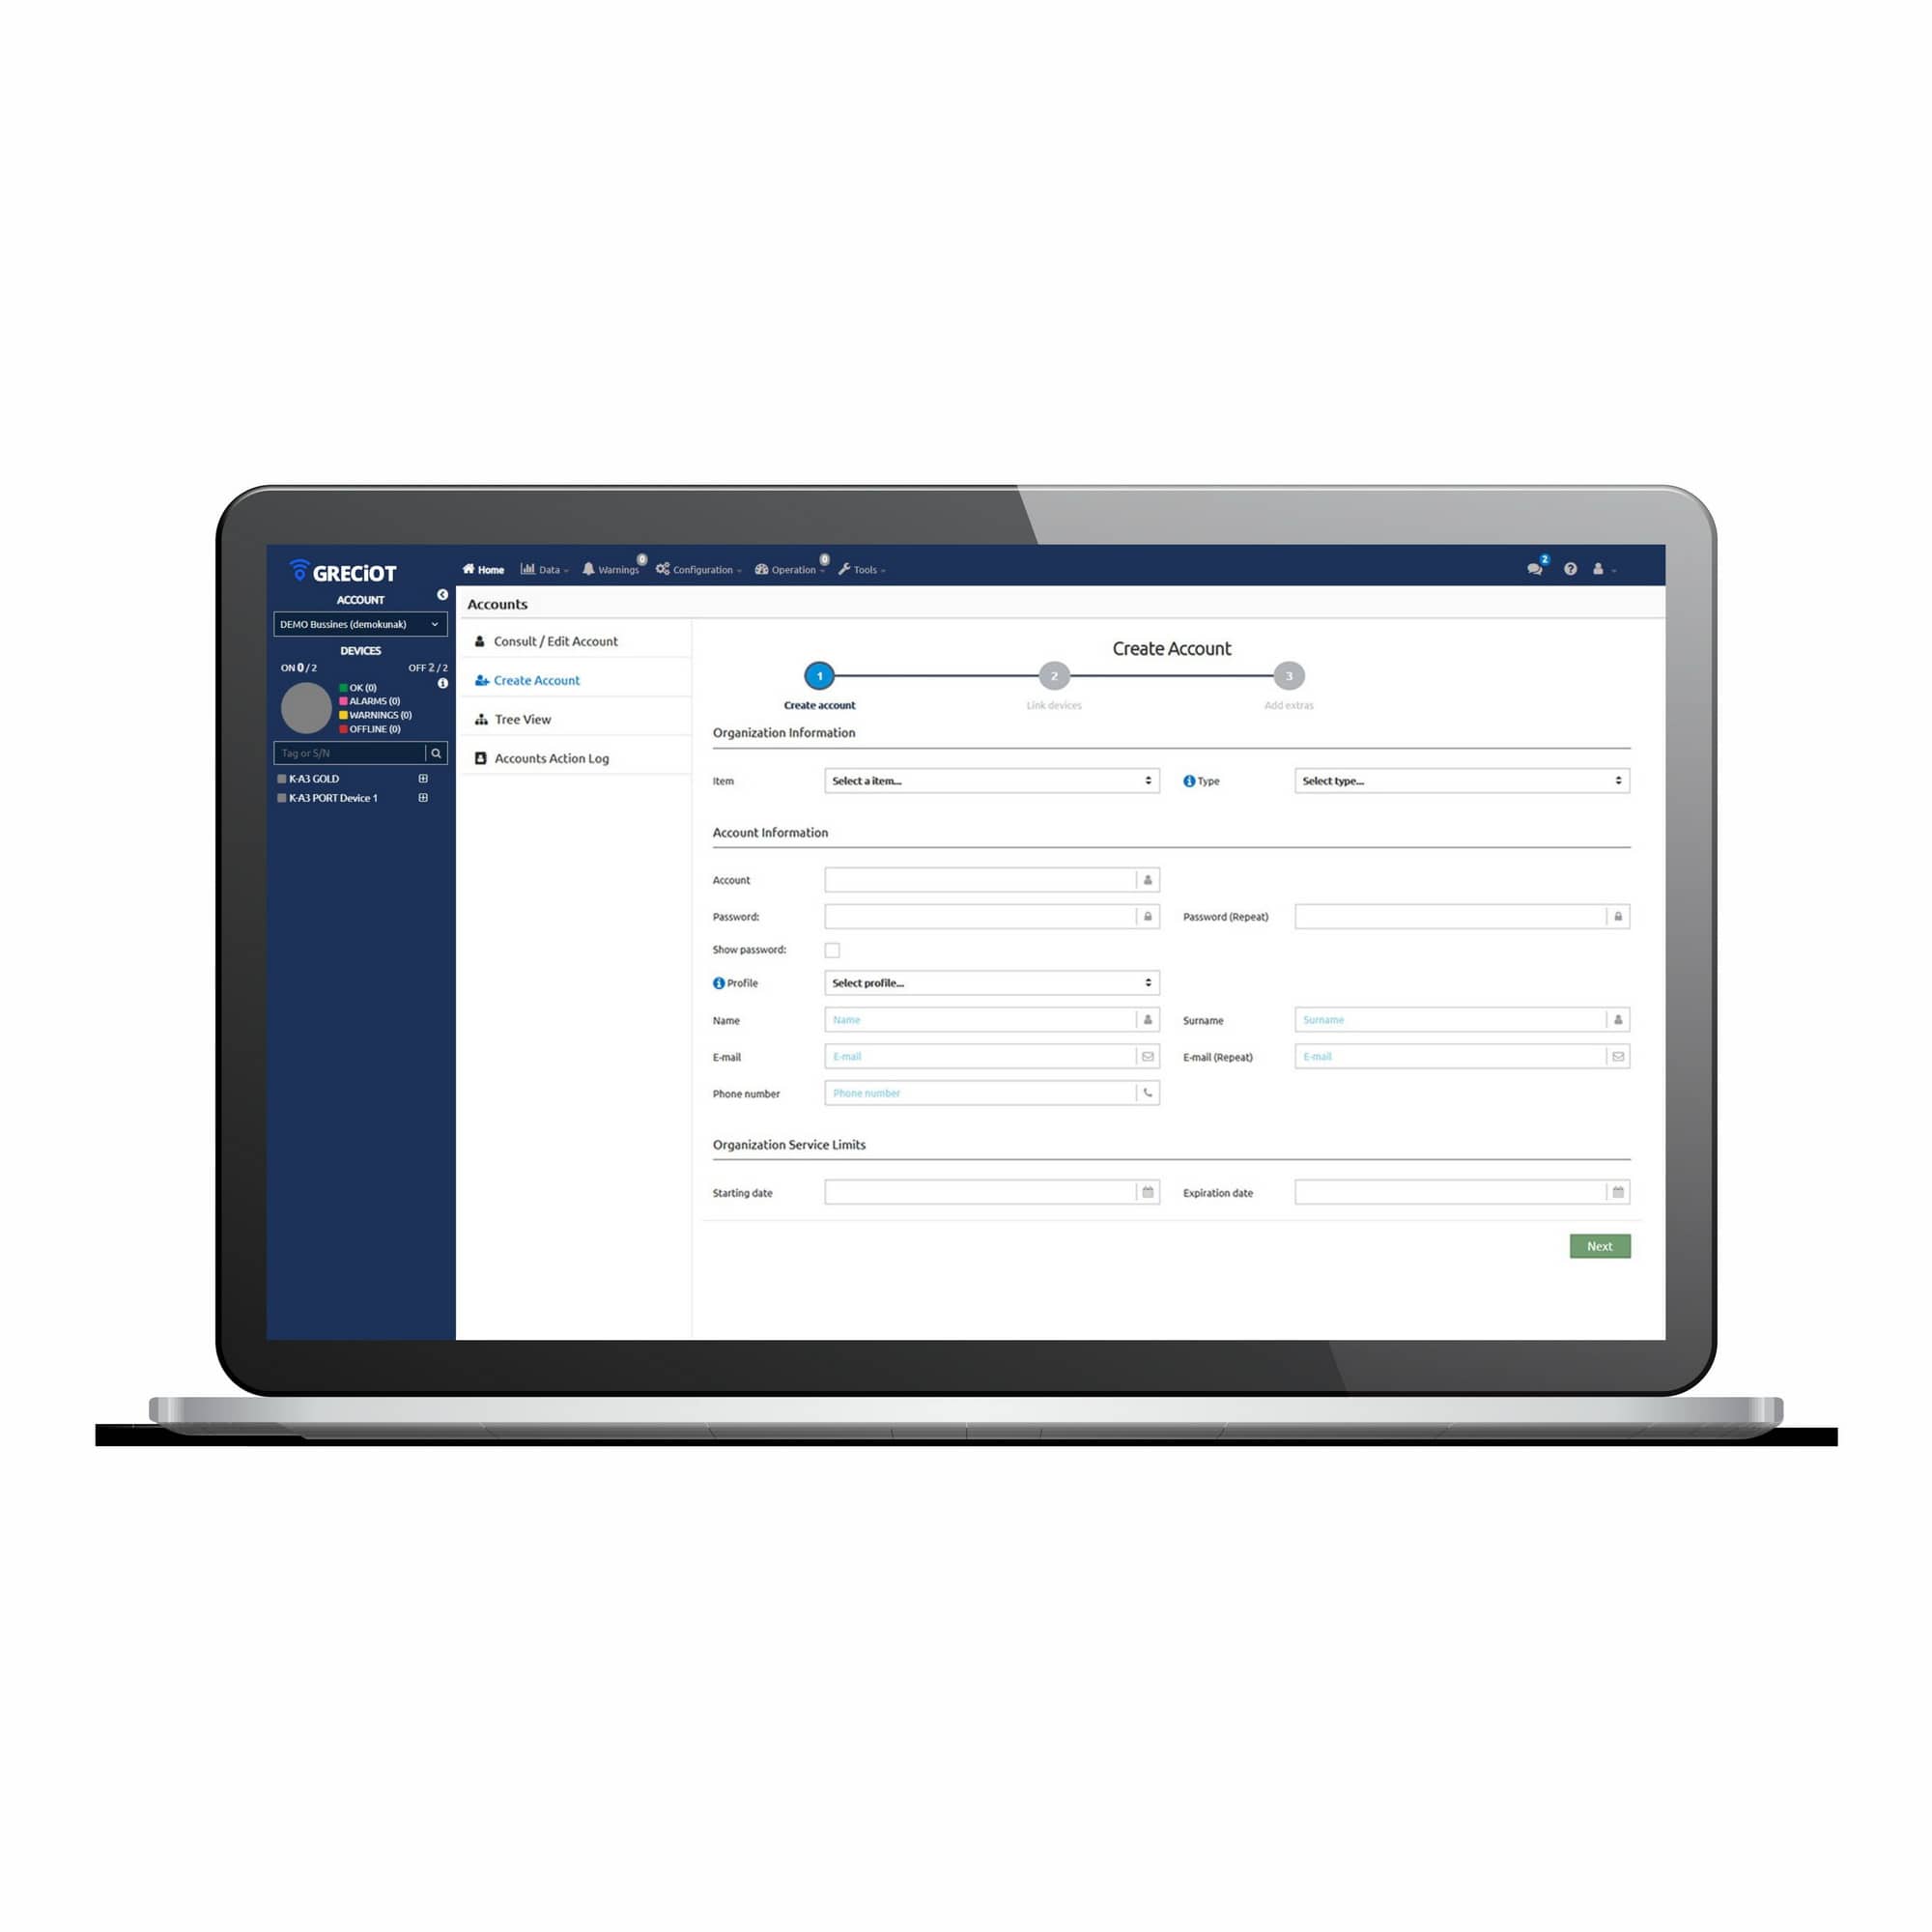
ACCOUNTS MANAGEMENT
AQI DASHBOARD
AQI TOOL
BASIC GRAPHS
CMMS
CONTROL PANEL
CUSTOMIZED REPORTS
DATA VALIDATION
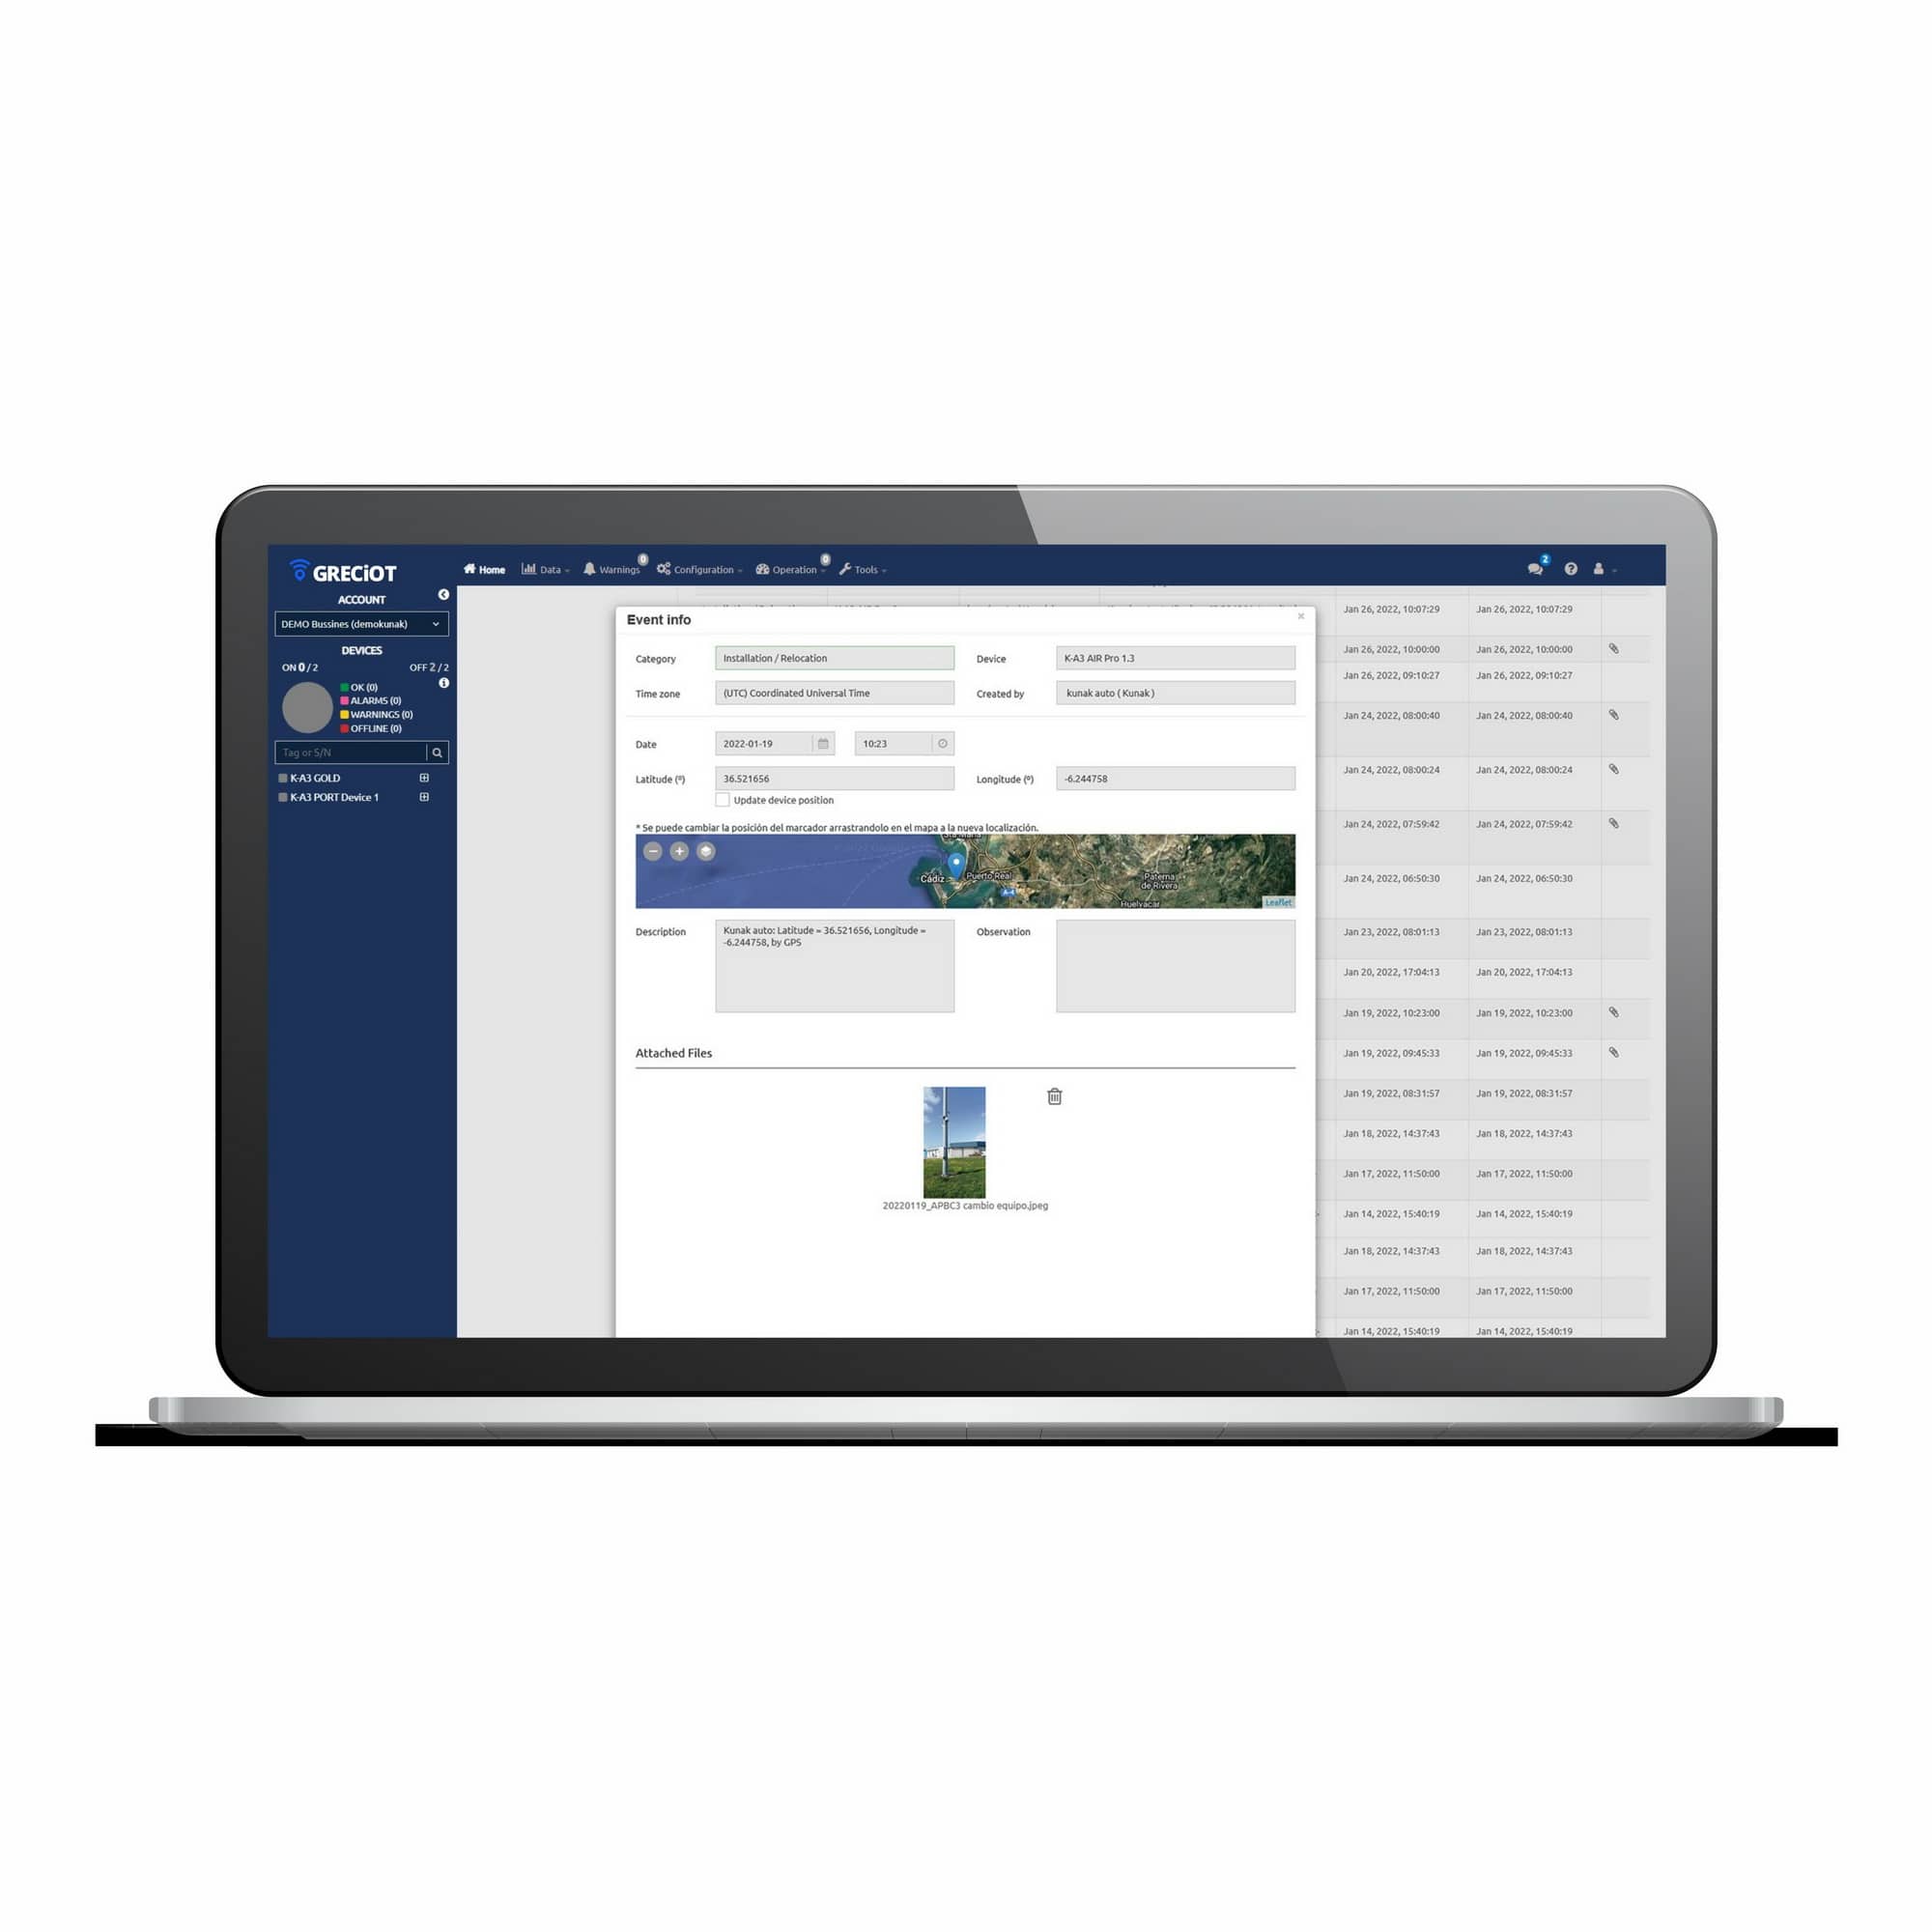
EVENTS LOG
HOTSPOTS IDENTIFICATION
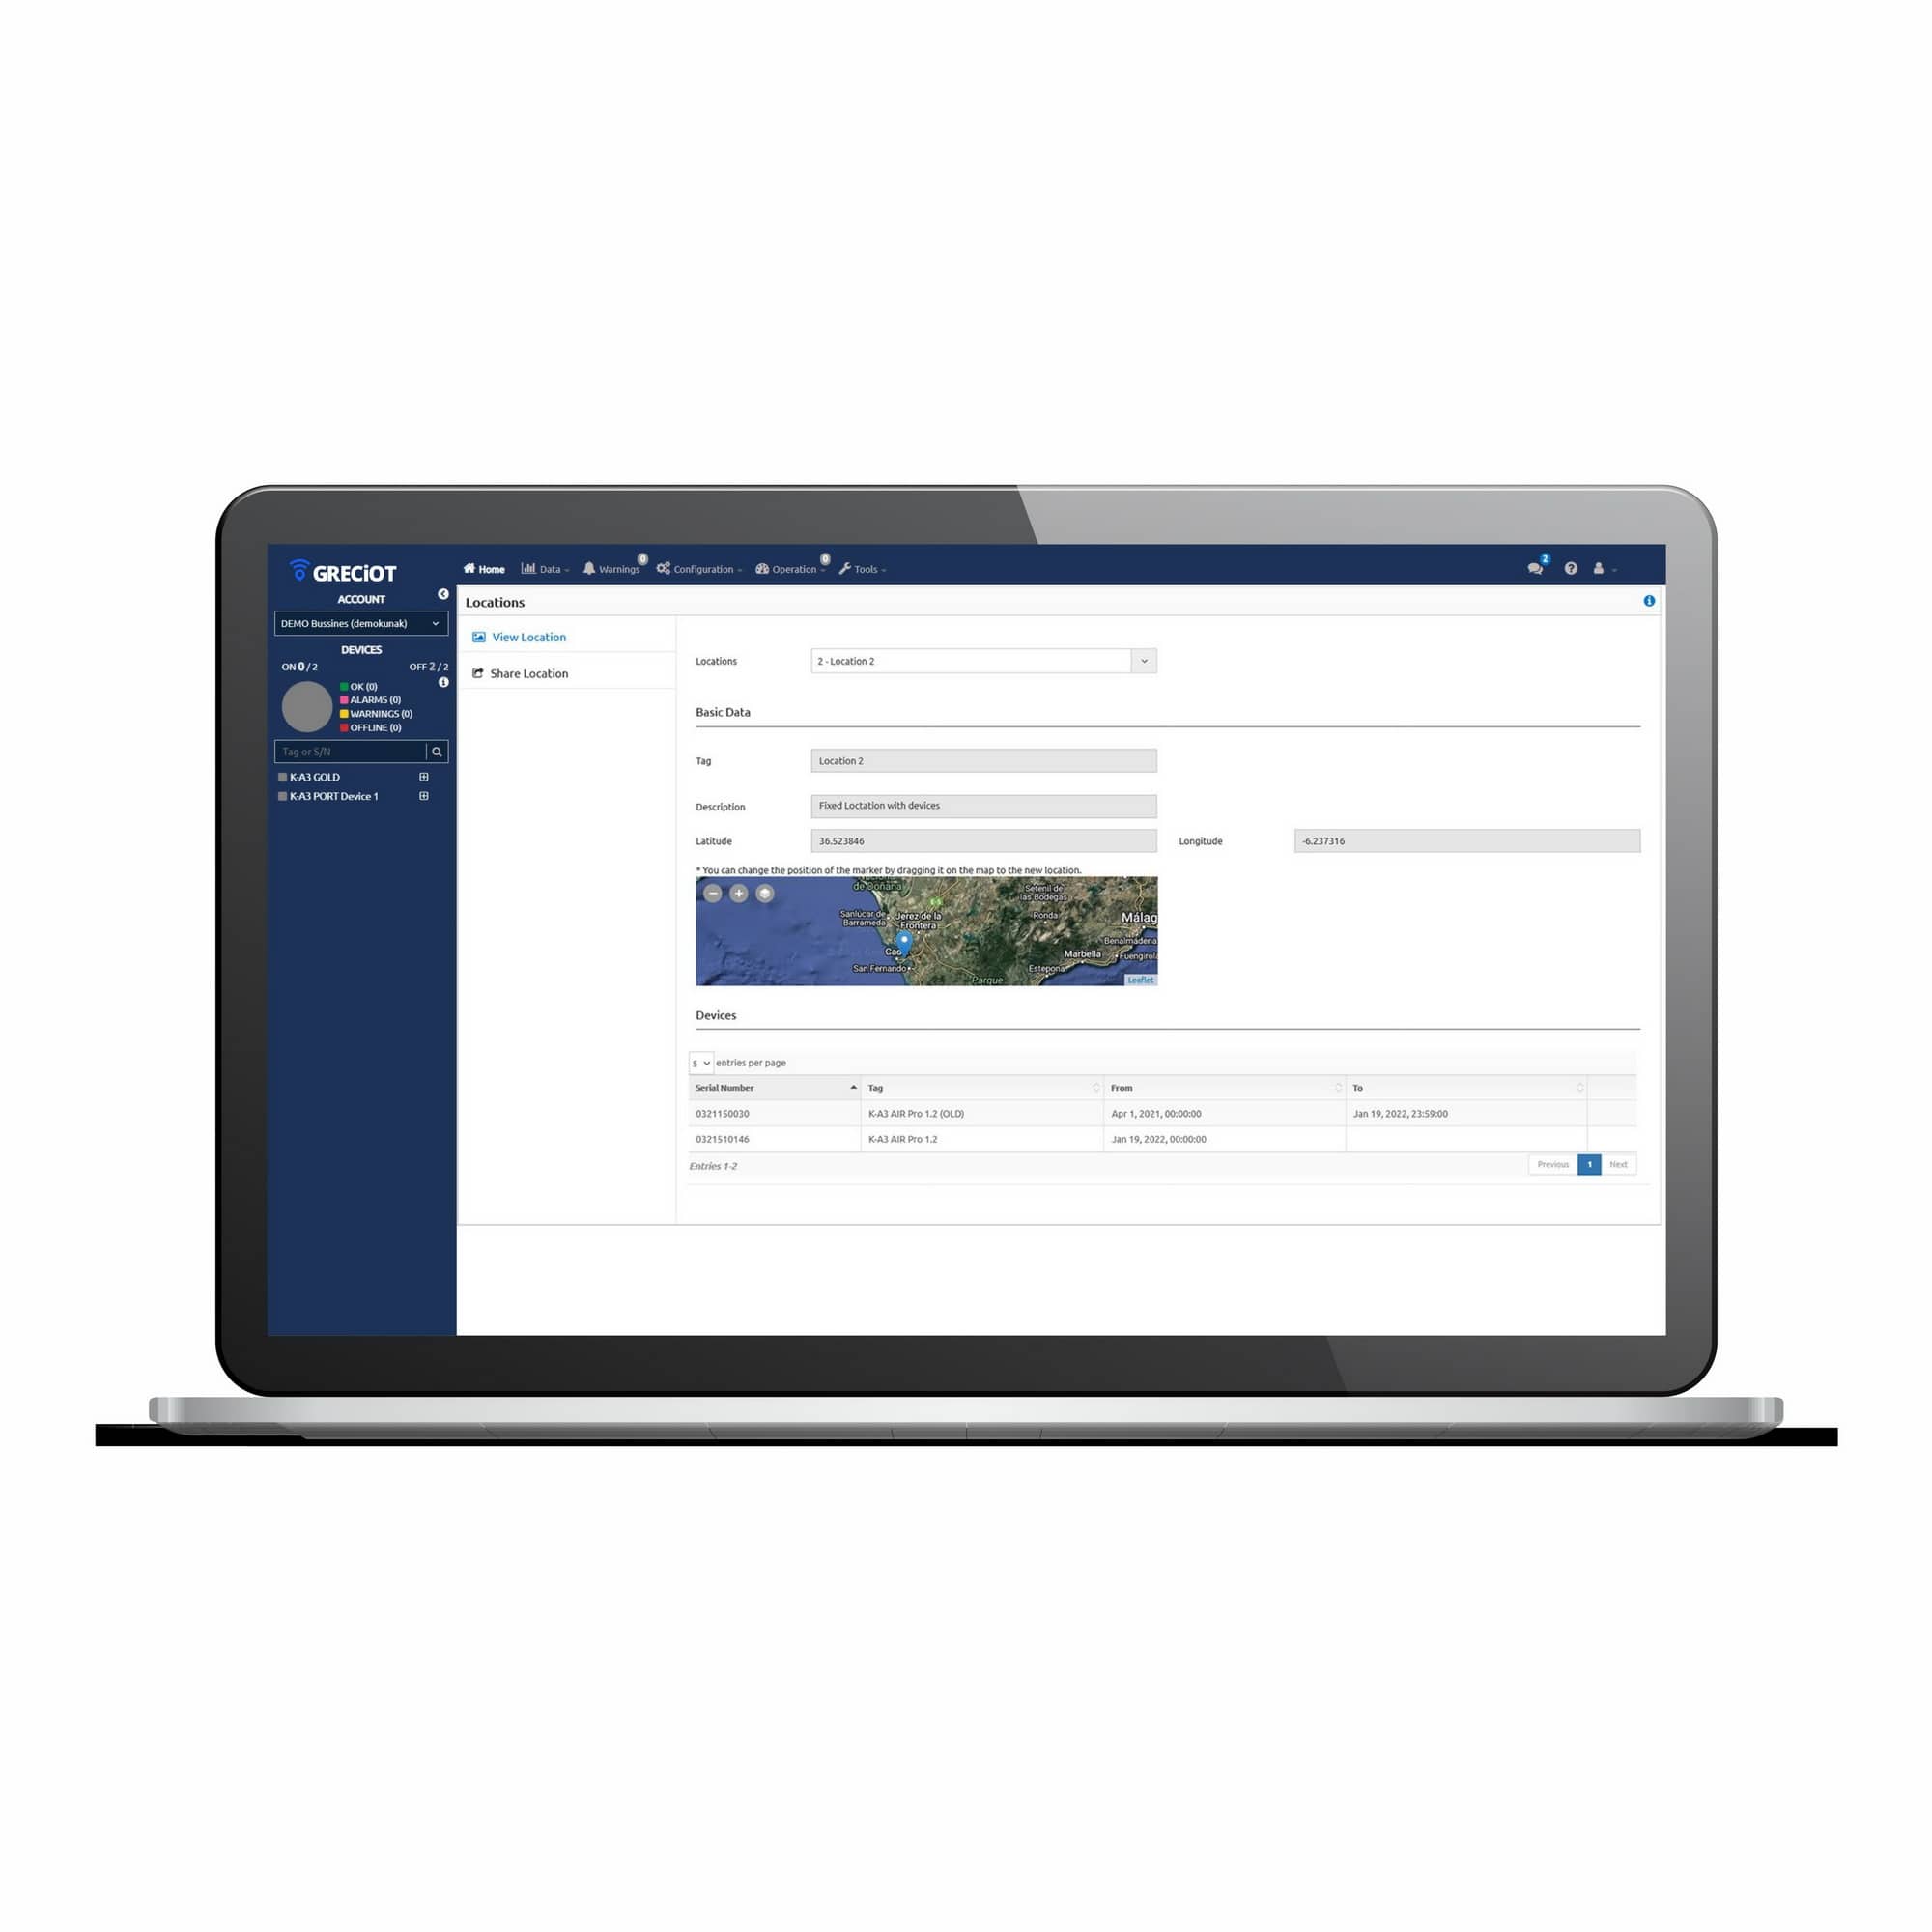
LOCATIONS LOG
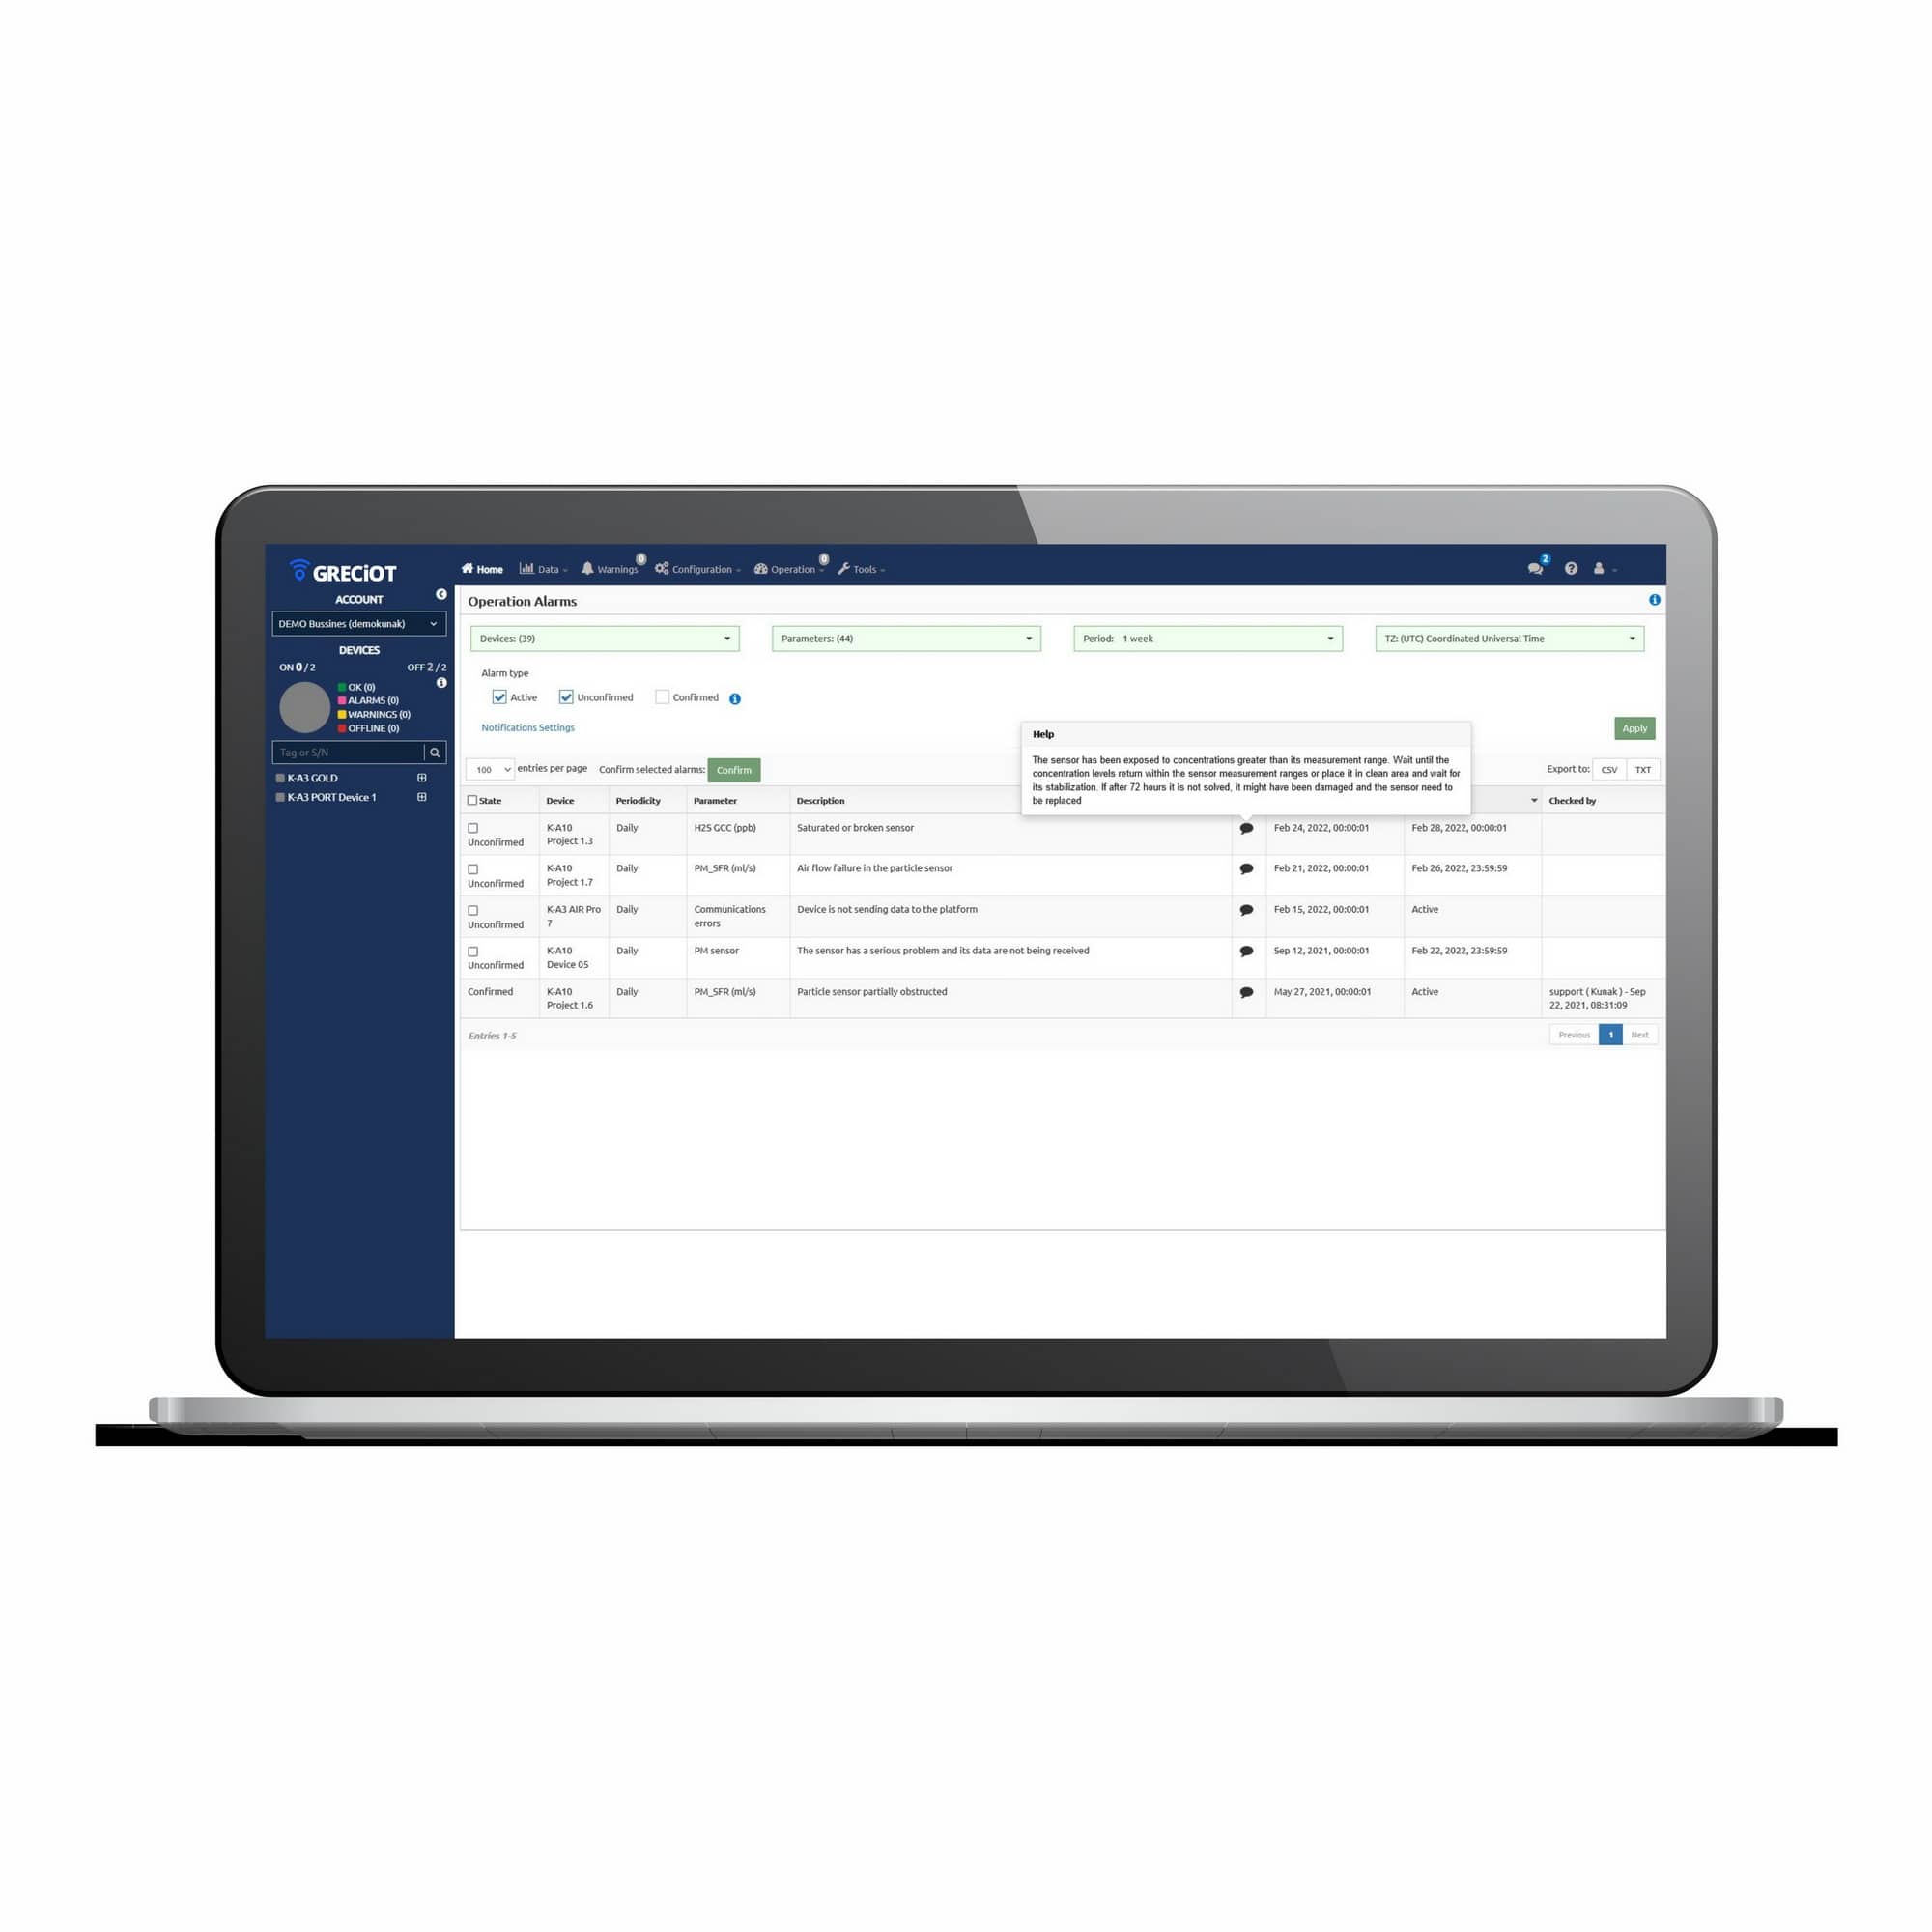
OPERATION ALARMS
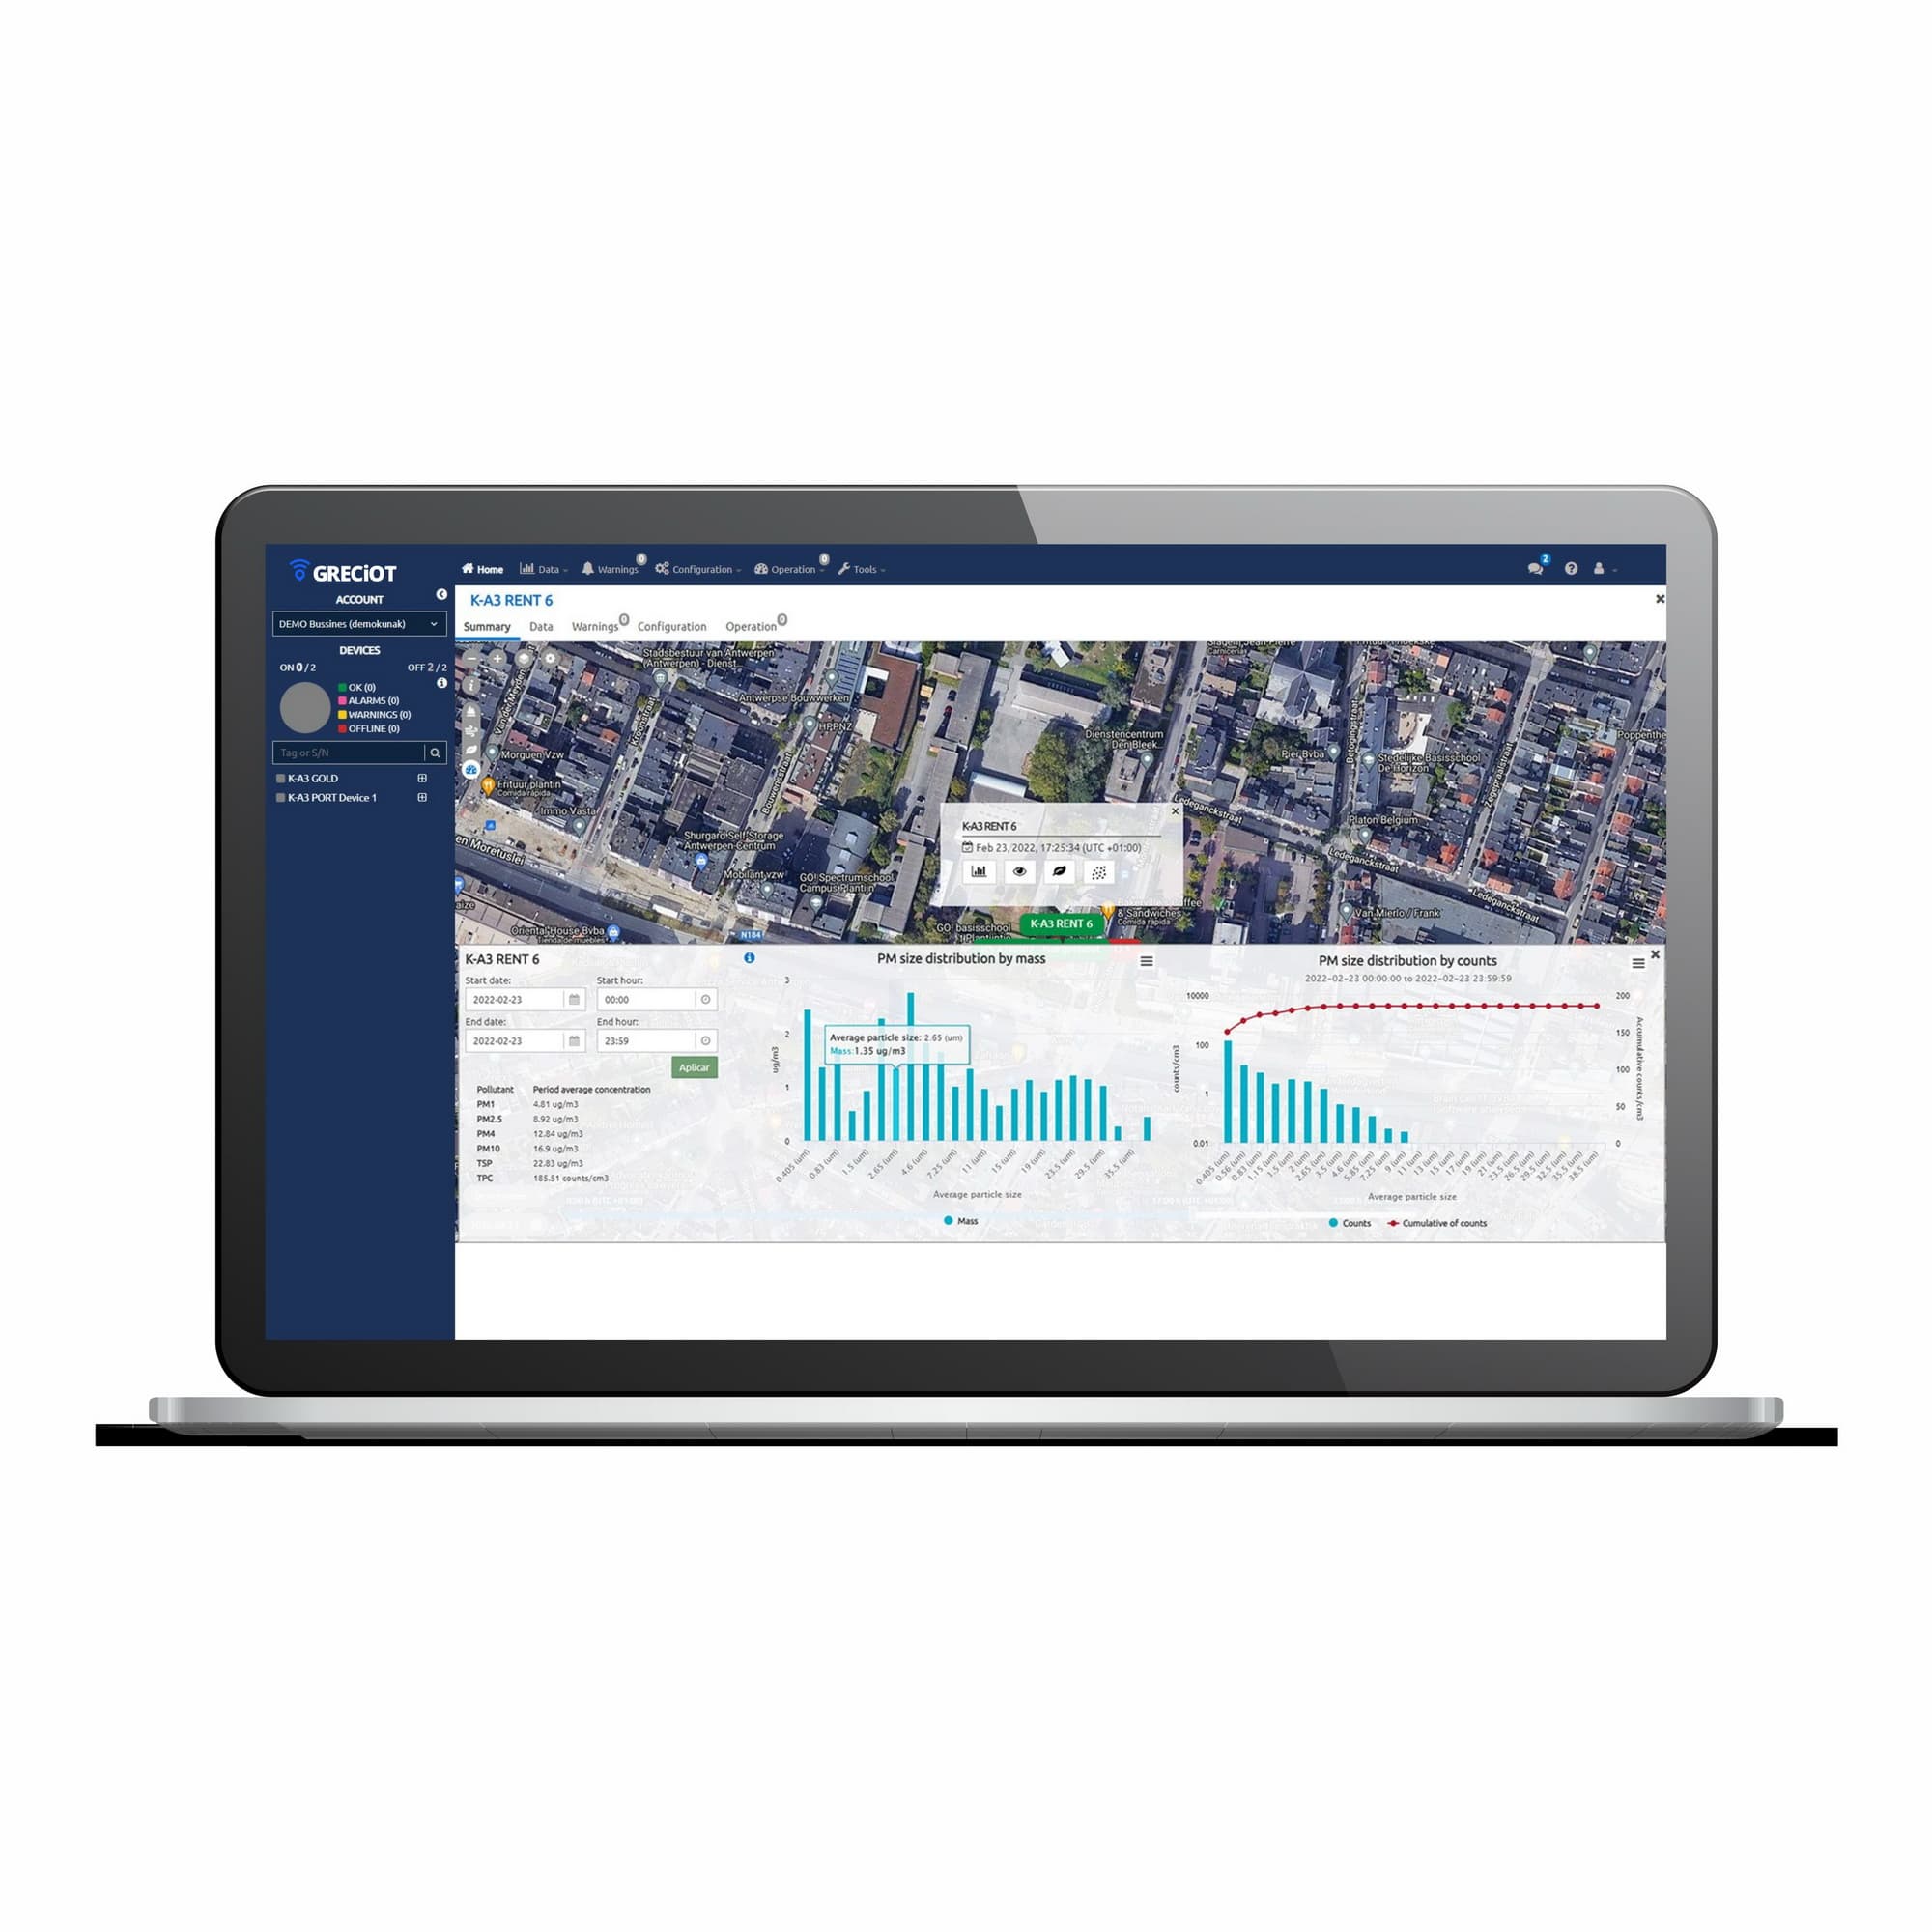
PARTICLE SIZE ANALYSIS
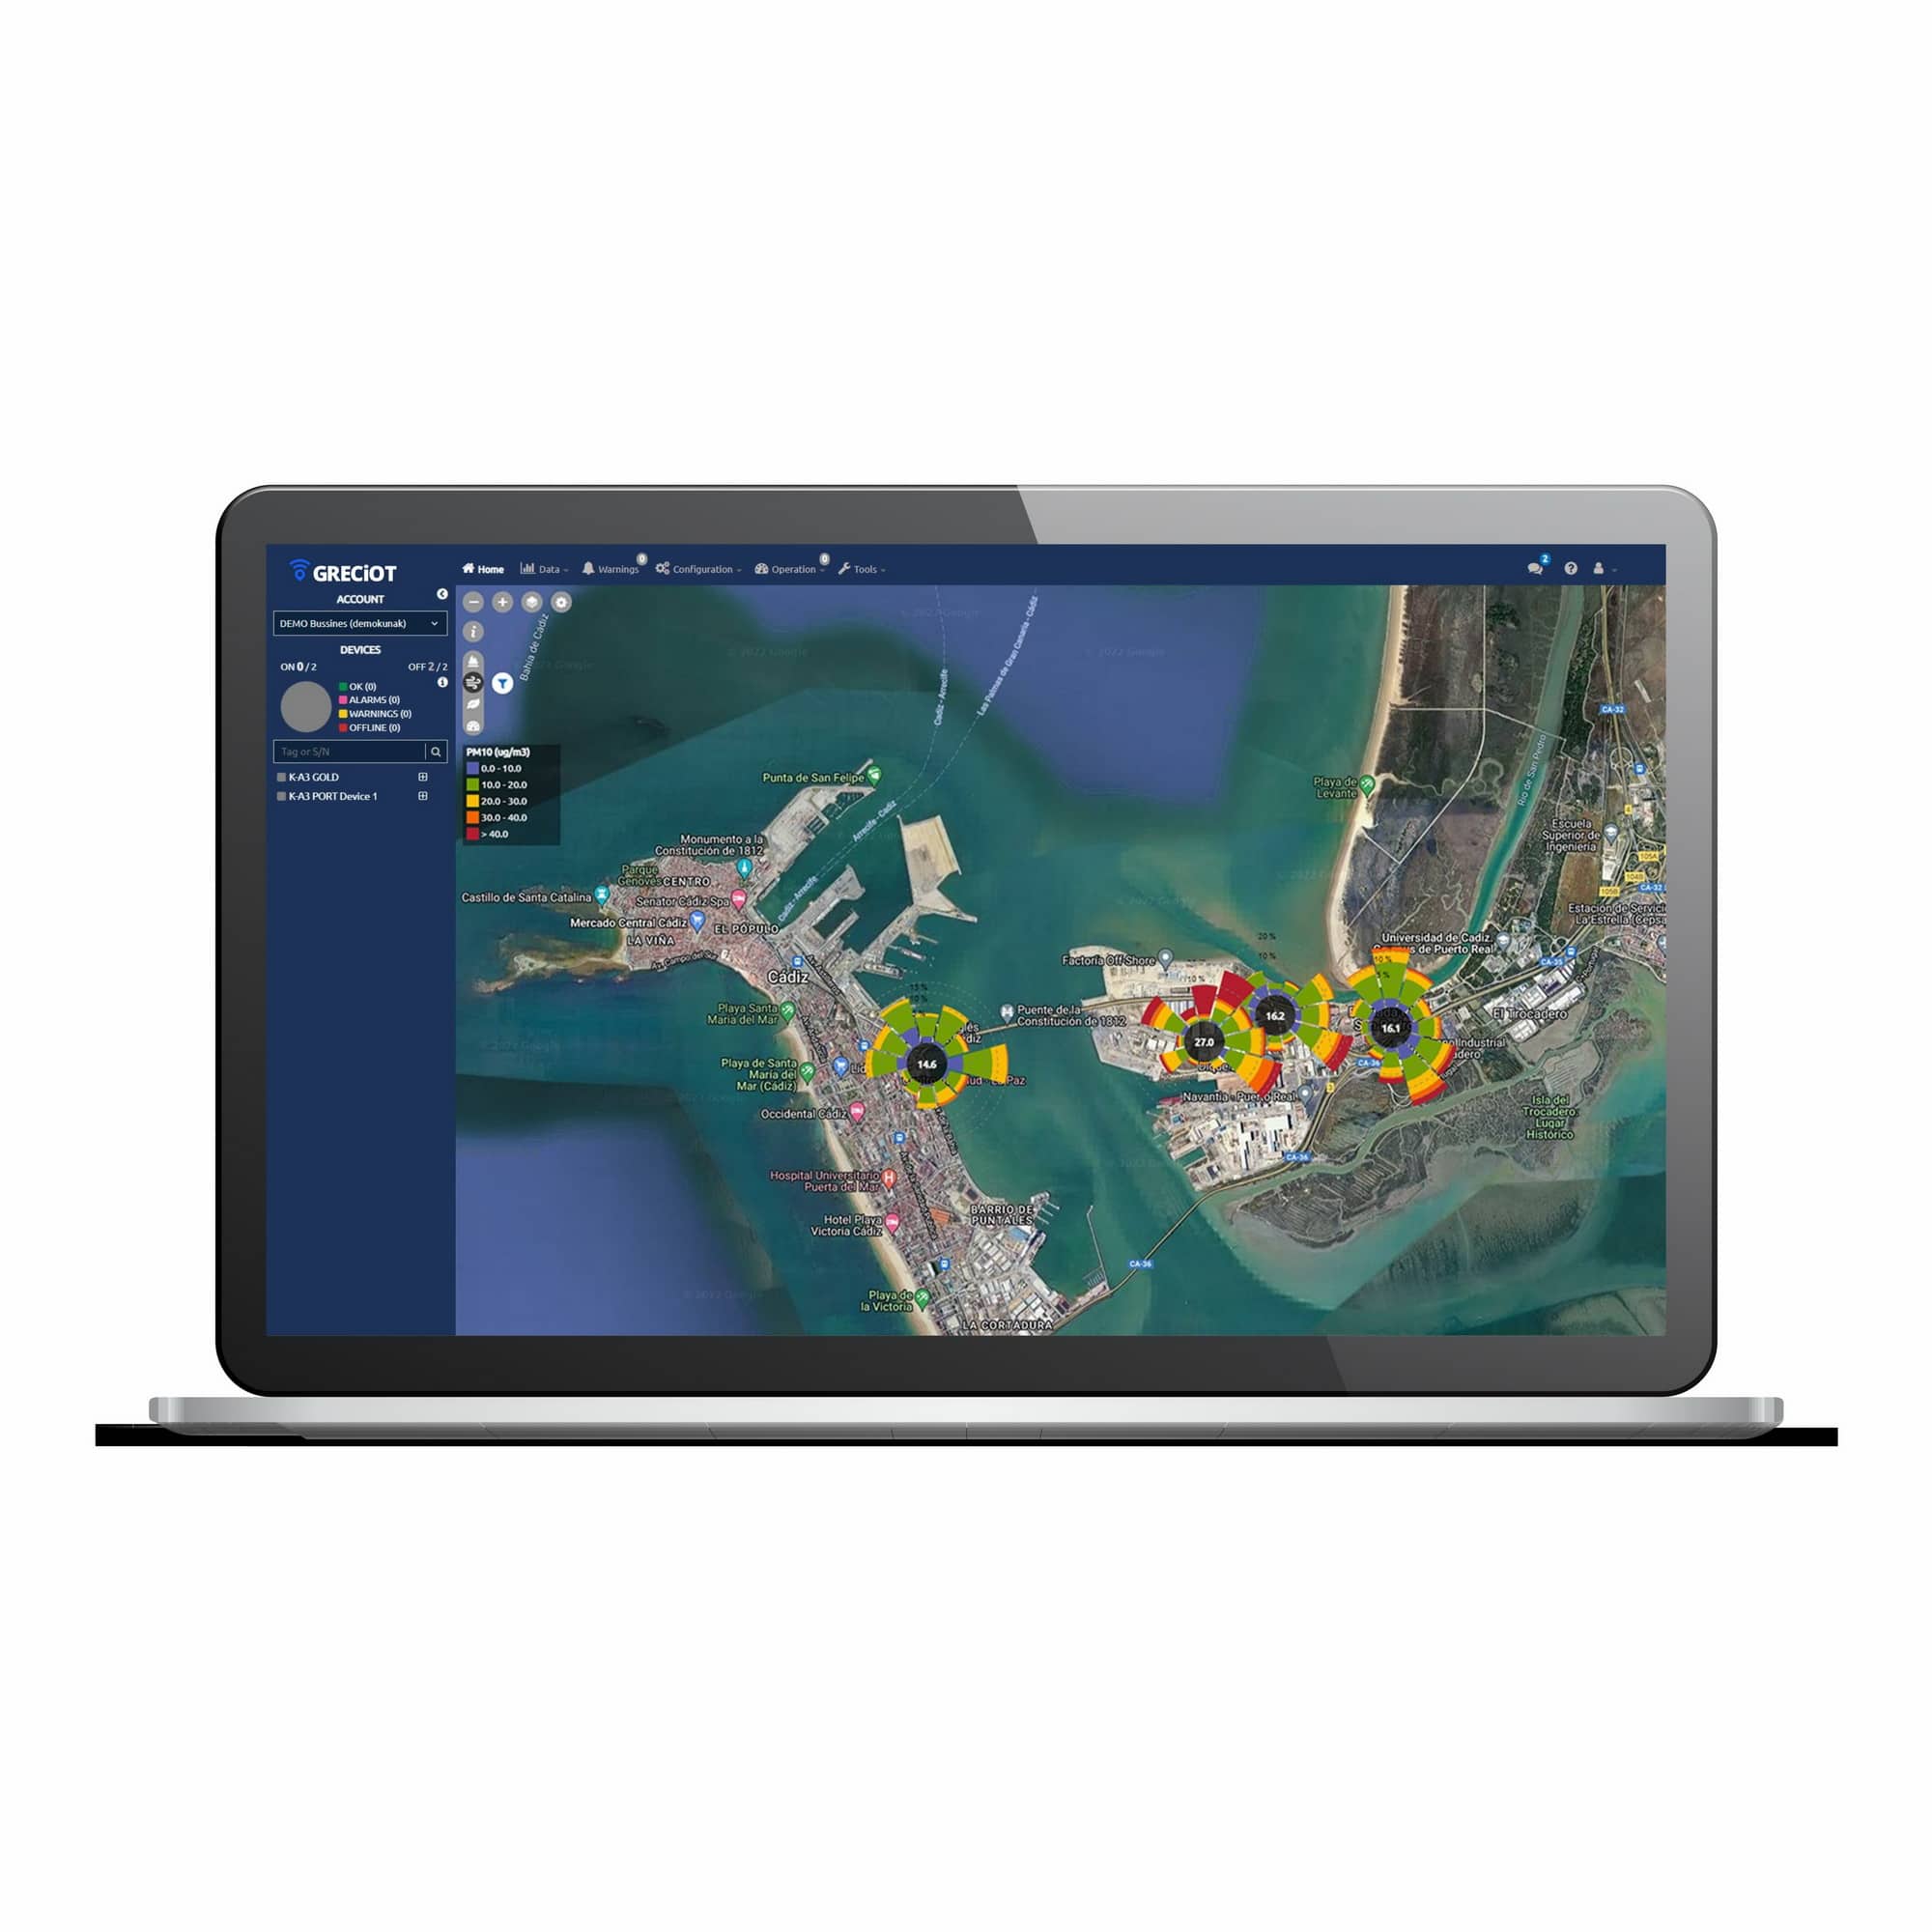
POLLUTION SOURCES CHARACTERIZATION